Tableau Courses
Tableau courses can help you learn data visualization techniques, dashboard creation, and data storytelling. You can build skills in data blending, creating calculated fields, and utilizing filters and parameters effectively. Many courses introduce tools like Tableau Desktop and Tableau Public, showing you how to connect to various data sources and transform raw data into insightful visual representations.
Popular Tableau Courses and Certifications
 Status: Free
Skills you'll gain: Dashboard, Interactive Data Visualization, Data Presentation, Tableau Software, Data Visualization Software, Data Analysis Software, Digital Publishing, Key Performance Indicators (KPIs), Data Import/Export
Skills you'll gain: Data Storytelling, Data Presentation, Data-Driven Decision-Making, Data Visualization, Interactive Data Visualization, Dashboard, Data Visualization Software, Tableau Software, Data Analysis, Exploratory Data Analysis

Coursera
Skills you'll gain: Data Visualization, Data Literacy, Data Presentation, Google Sheets, Data Compilation, Data Visualization Software, Graphing, Spreadsheet Software
 Status: Free
Skills you'll gain: Dashboard, Interactive Data Visualization, Tableau Software, Data Presentation, Data Import/Export, Data Visualization, Data Visualization Software, Business Intelligence, Data Analysis, Data Integration, Data Modeling
 Status: Free
Skills you'll gain: Dashboard, Data Visualization, Interactive Data Visualization, Data Presentation, Tableau Software, Data Visualization Software, Exploratory Data Analysis, Business Intelligence, Data Analysis
 Status: Free
Skills you'll gain: Dashboard, Tableau Software, Interactive Data Visualization, Financial Reporting, Financial Data, Business Reporting, Financial Statements, Business Intelligence, Financial Statement Analysis, Financial Analysis, Data Visualization Software, Performance Analysis, Key Performance Indicators (KPIs)
What brings you to Coursera today?

Skills you'll gain: Data Visualization, Microsoft Excel, Data Visualization Software, Data Import/Export, Business Reporting, Report Writing, Microsoft 365

Skills you'll gain: Data Storytelling, Pandas (Python Package), Data Analysis, Data-Driven Decision-Making, Exploratory Data Analysis, Analytical Skills, Business Analysis, Data Manipulation, Data Cleansing, Python Programming, Data Import/Export, Promotional Strategies

Skills you'll gain: Exploratory Data Analysis, Box Plots, Plot (Graphics), Data Visualization, Ggplot2, Data Visualization Software, Statistical Visualization, Scatter Plots, Histogram, Graphing, Python Programming

Skills you'll gain: Systems Integration, Dashboard, Cloud Applications, Software Installation, Content Performance Analysis, Social Media Management, Social Media, User Accounts, Content Marketing, Media Strategy, Digital Marketing

Skills you'll gain: Slack (Software), Social Media Management, Dashboard, Social Media, Collaborative Software, Facebook, Cloud-Based Integration, Continuous Integration

Skills you'll gain: Marketing Analytics, Dashboard, HubSpot CRM, Management Reporting, Marketing, Performance Reporting, Business Strategy, Leadership and Management
In summary, here are 10 of our most popular tableau courses
- Tableau Public for Beginners: Data Visualization Basics: Coursera
- Data Visualization in Tableau: Create Dashboards and Stories: Coursera
- Overview of Data Visualization: Coursera
- Multi-Table data analysis with Tableau: Customer Analysis: Coursera
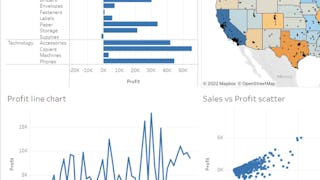
- Dynamic Dashboards with Tableau: Advanced Sales Analysis: Coursera
- Financial Reporting with Tableau: Parameters & Filters: Coursera
- Data Visualization using Microsoft Excel: Coursera
- Data Analysis with Python: Inform a Business Decision: Coursera
- Data Visualization using Plotnine and ggplot: Coursera
- Intégrer des applications dans votre Dashboard Hootsuite: Coursera


