Results for "graphing"

Skills you'll gain: Regression Analysis, Time Series Analysis and Forecasting, Forecasting, People Analytics, Trend Analysis, Microsoft Excel, Statistical Modeling, Excel Formulas, Predictive Modeling, Correlation Analysis, Statistical Methods, Predictive Analytics, Statistical Analysis, Data Analysis Software, Analytical Skills, Probability & Statistics, Graphing, Data Manipulation

Skills you'll gain: Dashboard, Data Visualization Software, Data Visualization, Statistical Visualization, Plot (Graphics), Interactive Data Visualization, Data Presentation, Graphing, Data Preprocessing, Data Manipulation, Scatter Plots, Data Wrangling, Data Analysis, Data Modeling, Software Installation, Data Integration, Data Access

Skills you'll gain: Unity Engine, Video Game Development, Programming Principles, General Mathematics, Plot (Graphics), Computer Graphics, Graphing, Computational Logic, Geometry, Data Structures, Applied Mathematics
Universitat Politècnica de València
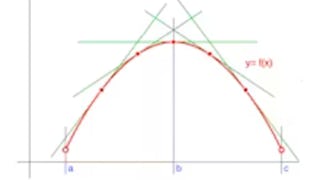
Skills you'll gain: Calculus, Applied Mathematics, Graphing, Algebra, Derivatives, Mathematical Theory & Analysis, Trigonometry

Universidad Austral
Skills you'll gain: Science and Research, Oral Expression, Teaching, Scientific Methods, General Science and Research, Instructional Strategies, Research, Interactive Learning, Student Engagement, Pedagogy, Experimentation, Discussion Facilitation, Social Impact, Graphing
Skills you'll gain: Kibana, Dashboard Creation, Dashboard, Interactive Data Visualization, Data Visualization, Data Visualization Software, Data Presentation, Grafana, Graphing, Data Analysis, Splunk, Real Time Data, Exploratory Data Analysis, Anomaly Detection, Time Series Analysis and Forecasting, Query Languages, SQL, Machine Learning Algorithms, Role-Based Access Control (RBAC), Qualitative Research

Skills you'll gain: Plot (Graphics), Scripting, Scientific Visualization, Graphing, Scripting Languages, Data Visualization Software, Code Reusability, Debugging, Matlab, Numerical Analysis, Mathematical Software, Applied Mathematics, Data Manipulation, Linear Algebra

Skills you'll gain: Exploratory Data Analysis, Data Storytelling, Ggplot2, Data Analysis, Plot (Graphics), R (Software), Regression Analysis, Data Presentation, R Programming, Statistical Analysis, Data Visualization Software, Statistical Visualization, Data Quality, Scatter Plots, Anomaly Detection, Descriptive Statistics, Analytical Skills, Correlation Analysis, Graphing

Skills you'll gain: Report Writing, SAS (Software), Data Store, Microsoft Excel, Business Reporting, Management Reporting, Spreadsheet Software, Data Presentation, HTML and CSS, Microsoft Word, Data Import/Export, Hypertext Markup Language (HTML), Cascading Style Sheets (CSS), Graphing

Politecnico di Milano
Skills you'll gain: Calculus, Mathematical Software, Applied Mathematics, Derivatives, General Mathematics, Mathematical Theory & Analysis, Geometry, Graphical Tools, Graphing

Skills you'll gain: Business Reporting, Data Presentation, Report Writing, Financial Reporting, Data Visualization, Concision, Data Storytelling, Data Visualization Software, Presentations, Storytelling, Communication, Graphing

Skills you'll gain: Matplotlib, Plot (Graphics), Data Preprocessing, Box Plots, E-Commerce, Business Analytics, Data-Driven Decision-Making, Descriptive Statistics, Histogram, Data Analysis, Graphing, Statistical Visualization, Data Transformation, Scatter Plots, Exploratory Data Analysis, Software Installation
In summary, here are 10 of our most popular graphing courses
- Apply and Predict: Time Series Forecasting in Excel: EDUCBA
- The Complete Tableau Bootcamp for Aspiring Data Scientists: Packt
- Introduction to Game Math and Basic Operations: Packt
- Bases Matemáticas: Derivadas: Universitat Politècnica de València
- Ciencias naturales en el nivel medio: del fenómeno a la idea: Universidad Austral
- Kibana 8.x – A Quick Start Guide to Data Analysis: Packt
- Octave Programming: Analyze, Apply & Implement: EDUCBA
- Apply Exploratory Data Analysis with R and ggplot2: EDUCBA
- Mastering SAS ODS: Create, Customize & Deliver Reports: EDUCBA
- Le Derivate: come si calcolano: Politecnico di Milano


