Kindly update the final assessment of this course work since it is quite difficult to work with it, as the content related to the assessment cannot be found in the course videos. Thanks !

Data Visualization with Python

Data Visualization with Python
This course is part of multiple programs.

Instructor: Saishruthi Swaminathan
Access provided by Universidade Estadual de Campinas
372,330 already enrolled
12,268 reviews
Intermediate level
Recommended experience
Flexible schedule
1 hour to complete
Learn at your own pace
91%
Most learners liked this course
What you'll learn
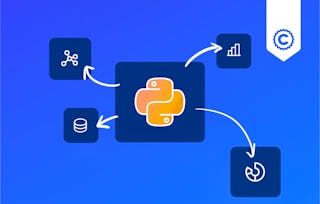
Implement data visualization techniques and plots using Python libraries, such as Matplotlib, Seaborn, and Folium to tell a stimulating story
Create different types of charts and plots such as line, area, histograms, bar, pie, box, scatter, and bubble
Create advanced visualizations such as waffle charts, word clouds, regression plots, maps with markers, & choropleth maps
Generate interactive dashboards containing scatter, line, bar, bubble, pie, and sunburst charts using the Dash framework and Plotly library
Skills you'll gain
Tools you'll learn
Details to know

Shareable certificate
Add to your LinkedIn profile
Taught in English
See how employees at top companies are mastering in-demand skills

Build your subject-matter expertise
This course is available as part of
When you enroll in this course, you'll also be asked to select a specific program.
- Learn new concepts from industry experts
- Gain a foundational understanding of a subject or tool
- Develop job-relevant skills with hands-on projects
- Earn a shareable career certificate

Why people choose Coursera for their career

Felipe M.
Learner since 2018
"To be able to take courses at my own pace and rhythm has been an amazing experience. I can learn whenever it fits my schedule and mood."

Jennifer J.
Learner since 2020
"I directly applied the concepts and skills I learned from my courses to an exciting new project at work."

Larry W.
Learner since 2021
"When I need courses on topics that my university doesn't offer, Coursera is one of the best places to go."

Chaitanya A.
"Learning isn't just about being better at your job: it's so much more than that. Coursera allows me to learn without limits."
Learner reviews
- 5 stars
68.80%
- 4 stars
19.22%
- 3 stars
6.26%
- 2 stars
2.89%
- 1 star
2.80%
Showing 3 of 12268
SS
Reviewed on Sep 24, 2019
JK
Reviewed on Jun 13, 2022
Great Course, however, not sure where I will use the Dash Dashboarding. Overall this is a high demanding topic that pushed me to the limit and have learnt a lot by completing this course
MH
Reviewed on Jun 7, 2020
The labs were good but the issue was the extremely rushed up videos. A lot of concepts, especially the artist layer was not covered will in the videos, which made me give this course 4 stars.