Results for "graphing"

Skills you'll gain: Presentations, Sales Presentations, Sales Presentation, Data Visualization, Productivity Software, Design
Skills you'll gain: Data Visualization, Plot (Graphics), Data Visualization Software, Statistical Visualization, Interactive Data Visualization, Visualization (Computer Graphics), Javascript, Data Analysis, Microsoft Visual Studio

Johns Hopkins University
Skills you'll gain: Shiny (R Package), Dashboard Creation, Dashboard, Ggplot2, Interactive Data Visualization, Data Visualization Software, Application Development, Data Sharing, UI Components, User Interface (UI), Application Deployment

Johns Hopkins University
Skills you'll gain: Rmarkdown, Data Visualization, Statistical Visualization, R (Software), Data Import/Export, Data Visualization Software, R Programming, Tidyverse (R Package), Statistical Reporting, Data Manipulation, Data Wrangling, Data Processing, File Management, Software Installation

University of Washington
Skills you'll gain: Data Visualization, Scientific Visualization, Data Ethics, Data Presentation, Statistical Visualization, Data Storytelling, Data Visualization Software, Data Sharing, Data Governance, Big Data, Technical Communication, Graphic and Visual Design, Cloud Computing, Amazon Web Services, Information Privacy, Ethical Standards And Conduct
University of Colorado Boulder
Skills you'll gain: Matplotlib, Statistical Visualization, Seaborn, Data Visualization, Data-Driven Decision-Making, Exploratory Data Analysis, Data Presentation, Plot (Graphics), Data Visualization Software, Descriptive Statistics, Pandas (Python Package), Data Analysis, Statistics, Statistical Analysis, Data Manipulation, Correlation Analysis, Python Programming

University of Pittsburgh
Skills you'll gain: Data Storytelling, Data Presentation, Interactive Data Visualization, Data Visualization Software, Data Visualization, Network Analysis, Tableau Software, Network Model, Dashboard Creation, Dashboard, Time Series Analysis and Forecasting, Matplotlib, Data Analysis, Seaborn, Graph Theory, Python Programming
Birla Institute of Technology & Science, Pilani
Skills you'll gain: Graph Theory, Network Analysis, Social Network Analysis, Combinatorics, Network Model, Mathematical Modeling, Transportation Operations, Image Analysis, Algorithms, Theoretical Computer Science, Artificial Intelligence and Machine Learning (AI/ML), Model Optimization, Computational Thinking, Problem Solving, Embeddings

Skills you'll gain: Data Storytelling, Seaborn, Data Visualization, Dashboard Creation, Data Presentation, Matplotlib, Interactive Data Visualization, Dashboard, Statistical Visualization, Time Series Analysis and Forecasting, Microsoft Excel, Generative AI, Tableau Software, Data-Driven Decision-Making, Business Intelligence, Data Analysis, Business Analytics, Power BI, Google Sheets, Python Programming

Skills you'll gain: Plot (Graphics), Pandas (Python Package), Data Visualization, Data Manipulation, Statistical Visualization, Data Processing, Data Import/Export, Regression Analysis

Skills you'll gain: Data Visualization, Statistical Visualization, Microsoft Excel, Data Visualization Software, Spreadsheet Software, Pivot Tables And Charts, Exploratory Data Analysis, Data Analysis Software, Data Analysis, Plot (Graphics)

Skills you'll gain: Plot (Graphics), Data Storytelling, Heat Maps, Data Mapping
In summary, here are 10 of our most popular graphing courses
- Presenting Data Using Charts with Canva: Coursera
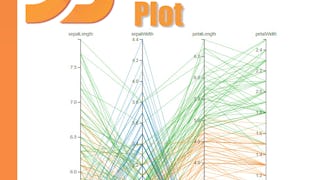
- Simple Parallel Coordinates Plot using d3 js: Coursera
- Publishing Visualizations in R with Shiny and flexdashboard: Johns Hopkins University
- Getting Started with Data Visualization in R: Johns Hopkins University
- Communicating Data Science Results: University of Washington
- Data Understanding and Visualization: University of Colorado Boulder
- Tableau, Networks & Time Series Data Visualization: University of Pittsburgh
- Graphs and Networks: Birla Institute of Technology & Science, Pilani
- Data Visualization Primer: Tools & Techniques: Coursera
- Python for Data Visualization - A Beginner's Guide: Packt


