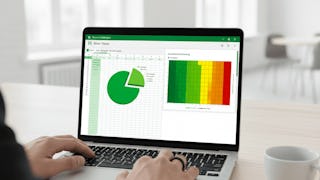
Excel Dashboard Courses
Excel Dashboard courses can help you learn data visualization techniques, how to create interactive dashboards, and effective data analysis methods. You can build skills in using formulas, pivot tables, and conditional formatting to present data clearly and concisely. Many courses introduce tools like Excel's Power Query and Power Pivot, which enhance your ability to manipulate large datasets and automate reporting processes.
Popular Excel Dashboard Courses and Certifications

Skills you'll gain: Microsoft Excel, Excel Formulas, Spreadsheet Software, Data Management, Data Analysis, Analytics, Data Cleansing, Pivot Tables And Charts, Data Visualization, Data Presentation, Advanced Analytics, Data Entry, Statistical Analysis, Data Import/Export, Data Quality, Data Processing, Correlation Analysis, Statistical Methods, Data-Driven Decision-Making, Data Integrity
 Status: NewStatus: Free Trial
Skills you'll gain: Microsoft Excel, Pivot Tables And Charts, Business Intelligence, Spreadsheet Software, Business Reporting, Data Visualization, Interactive Data Visualization, Data Presentation, Dashboard, Dashboard Creation, Data Analysis, Data Visualization Software, Data-Driven Decision-Making, Data Transformation, Analysis, Predictive Analytics, Data Management
 Status: NewStatus: Free Trial
Skills you'll gain: Data Entry, Excel Formulas, Microsoft Excel, Data Management, Spreadsheet Software, Microsoft Office, Data Presentation, Productivity Software
 Status: Free Trial
Skills you'll gain: Data Storytelling, Data Presentation, Data Visualization Software, Data Visualization, Interactive Data Visualization, Dashboard, Dashboard Creation, Tableau Software, Microsoft Excel, Excel Formulas, Pivot Tables And Charts, Spreadsheet Software, Data Analysis Software, Business Intelligence, Performance Tuning, Data Analysis, Analytics, Analytical Skills, Business Metrics
 Status: NewStatus: Free Trial
Skills you'll gain: Dashboard Creation, Data Storytelling, Dashboard, Market Data, Data-Driven Decision-Making, Tableau Software, Data Presentation, Financial Market, Interactive Data Visualization, Financial Data, Financial Analysis, Storytelling, Business Intelligence, Data Analysis, Data Visualization, Data Visualization Software, Analytics, Trend Analysis
Skills you'll gain: Dashboard, Dashboard Creation, Data Visualization, Interactive Data Visualization, Data Presentation, Tableau Software, Data Visualization Software, Exploratory Data Analysis, Business Intelligence, Data Analysis
 Status: Free Trial
University of Colorado Boulder
Skills you'll gain: Dashboard, Dashboard Creation, Tableau Software, Interactive Data Visualization, Data Storytelling, Data Presentation, Data Visualization Software, Statistical Visualization, Business Analytics, Marketing Analytics
 Status: NewStatus: Free Trial
Coursera
Skills you'll gain: Dashboard, Dashboard Creation, User Feedback, Data Presentation, Data Storytelling, Data Visualization, Organizational Skills, Usability Testing, Data-Driven Decision-Making, Team Performance Management, Constructive Feedback, Project Performance, Prioritization, Project Scoping, Jira (Software), Stakeholder Management

Packt
Skills you'll gain: Microsoft Excel, Spreadsheet Software, Data Cleansing, Data Visualization, Data Analysis Software, Productivity Software, Data Security, Data Management, Editing, Workflow Management
 Status: Free Trial
University of California, Irvine
Skills you'll gain: Dashboard Creation, Dashboard, Data Storytelling, Data Presentation, Interactive Data Visualization, Data Visualization Software, Tableau Software, Market Data, Geospatial Information and Technology, Data Analysis, Analytical Skills, Application Deployment, Network Analysis, Financial Data, Financial Analysis
 Status: NewStatus: Free Trial
Logical Operations
Skills you'll gain: Power BI, Dashboard Creation, Dashboard, Collaborative Software, Collaboration, Data Sharing, Microsoft Power Platform, Microsoft Excel, Business Intelligence, Microsoft 365, Interactive Data Visualization, Microsoft PowerPoint, Data Analysis Software, Performance Tuning, Data Analysis
 Status: Free Trial
Skills you'll gain: Interactive Data Visualization, Exploratory Data Analysis, Dashboard, Dashboard Creation, Data Presentation, Data Integration, Heat Maps, Datamaps, Spatial Data Analysis, Data-Driven Decision-Making, Decision Support Systems, Business Intelligence Software, Spatial Analysis, Geospatial Information and Technology, Data Mapping
In summary, here are 10 of our most popular excel dashboard courses
- Data Analytics in Excel Using Real-World Examples: Packt
- Business Intelligence & Data Visualization in Excel: EDUCBA
- Apply Microsoft Excel Basics for Data Management: EDUCBA
- Data Visualization with Tableau and Microsoft Excel: Coursera
- Analyze Financial Markets with Tableau Dashboards: EDUCBA
- Dynamic Dashboards with Tableau: Advanced Sales Analysis: Coursera
- Essential Dashboarding & Storytelling Techniques: University of Colorado Boulder
- Build Insight Dashboards: Coursera
- Excel Essentials: Packt
- Dashboarding and Deployment: University of California, Irvine


