
Filter by
The language used throughout the course, in both instruction and assessments.
344 results for "heat map"
Coursera Project Network
Skills you'll gain: Data Science, Data Visualization, Python Programming
Coursera Project Network
Skills you'll gain: Data Analysis, Data Visualization, Statistical Analysis
University of Michigan

Skills you'll gain: Python Programming, Computer Programming, Data Analysis, Data Visualization
 Status: Free
The University of Tokyo
Skills you'll gain: Computer Graphics, Algorithms

Coursera Project Network
Skills you'll gain: Computer Graphics, Graphic Design, Marketing
Coursera Project Network
Coursera Project Network
Skills you'll gain: Data Visualization, Microsoft Excel, SQL

University of Michigan
Skills you'll gain: Computer Graphics, Computer Programming, Data Visualization, Plot (Graphics), Python Programming
University of Toronto
Skills you'll gain: GIS Software, ArcGIS, Geovisualization
 Status: Free
The University of Chicago

Macquarie University
Skills you'll gain: Data Analysis, Data Management, Data Structures, Data Visualization, Data Visualization Software, Interactive Data Visualization, Interactive Design, Microsoft Excel, Spreadsheet Software, Visual Design
Searches related to heat map
In summary, here are 10 of our most popular heat map courses
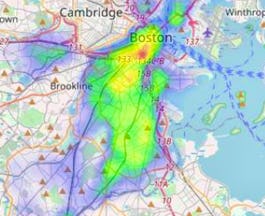
- Crime Zone Heatmaps with Python and Folium: Coursera Project Network
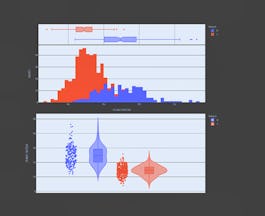
- Interactive Statistical Data Visualization 101: Coursera Project Network
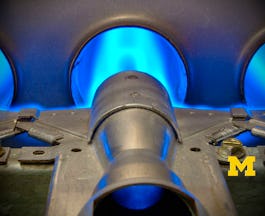
- Introduction to Thermodynamics: Transferring Energy from Here to There: University of Michigan
- Data Visualization with Python: IBM
- Interactive Computer Graphics: The University of Tokyo
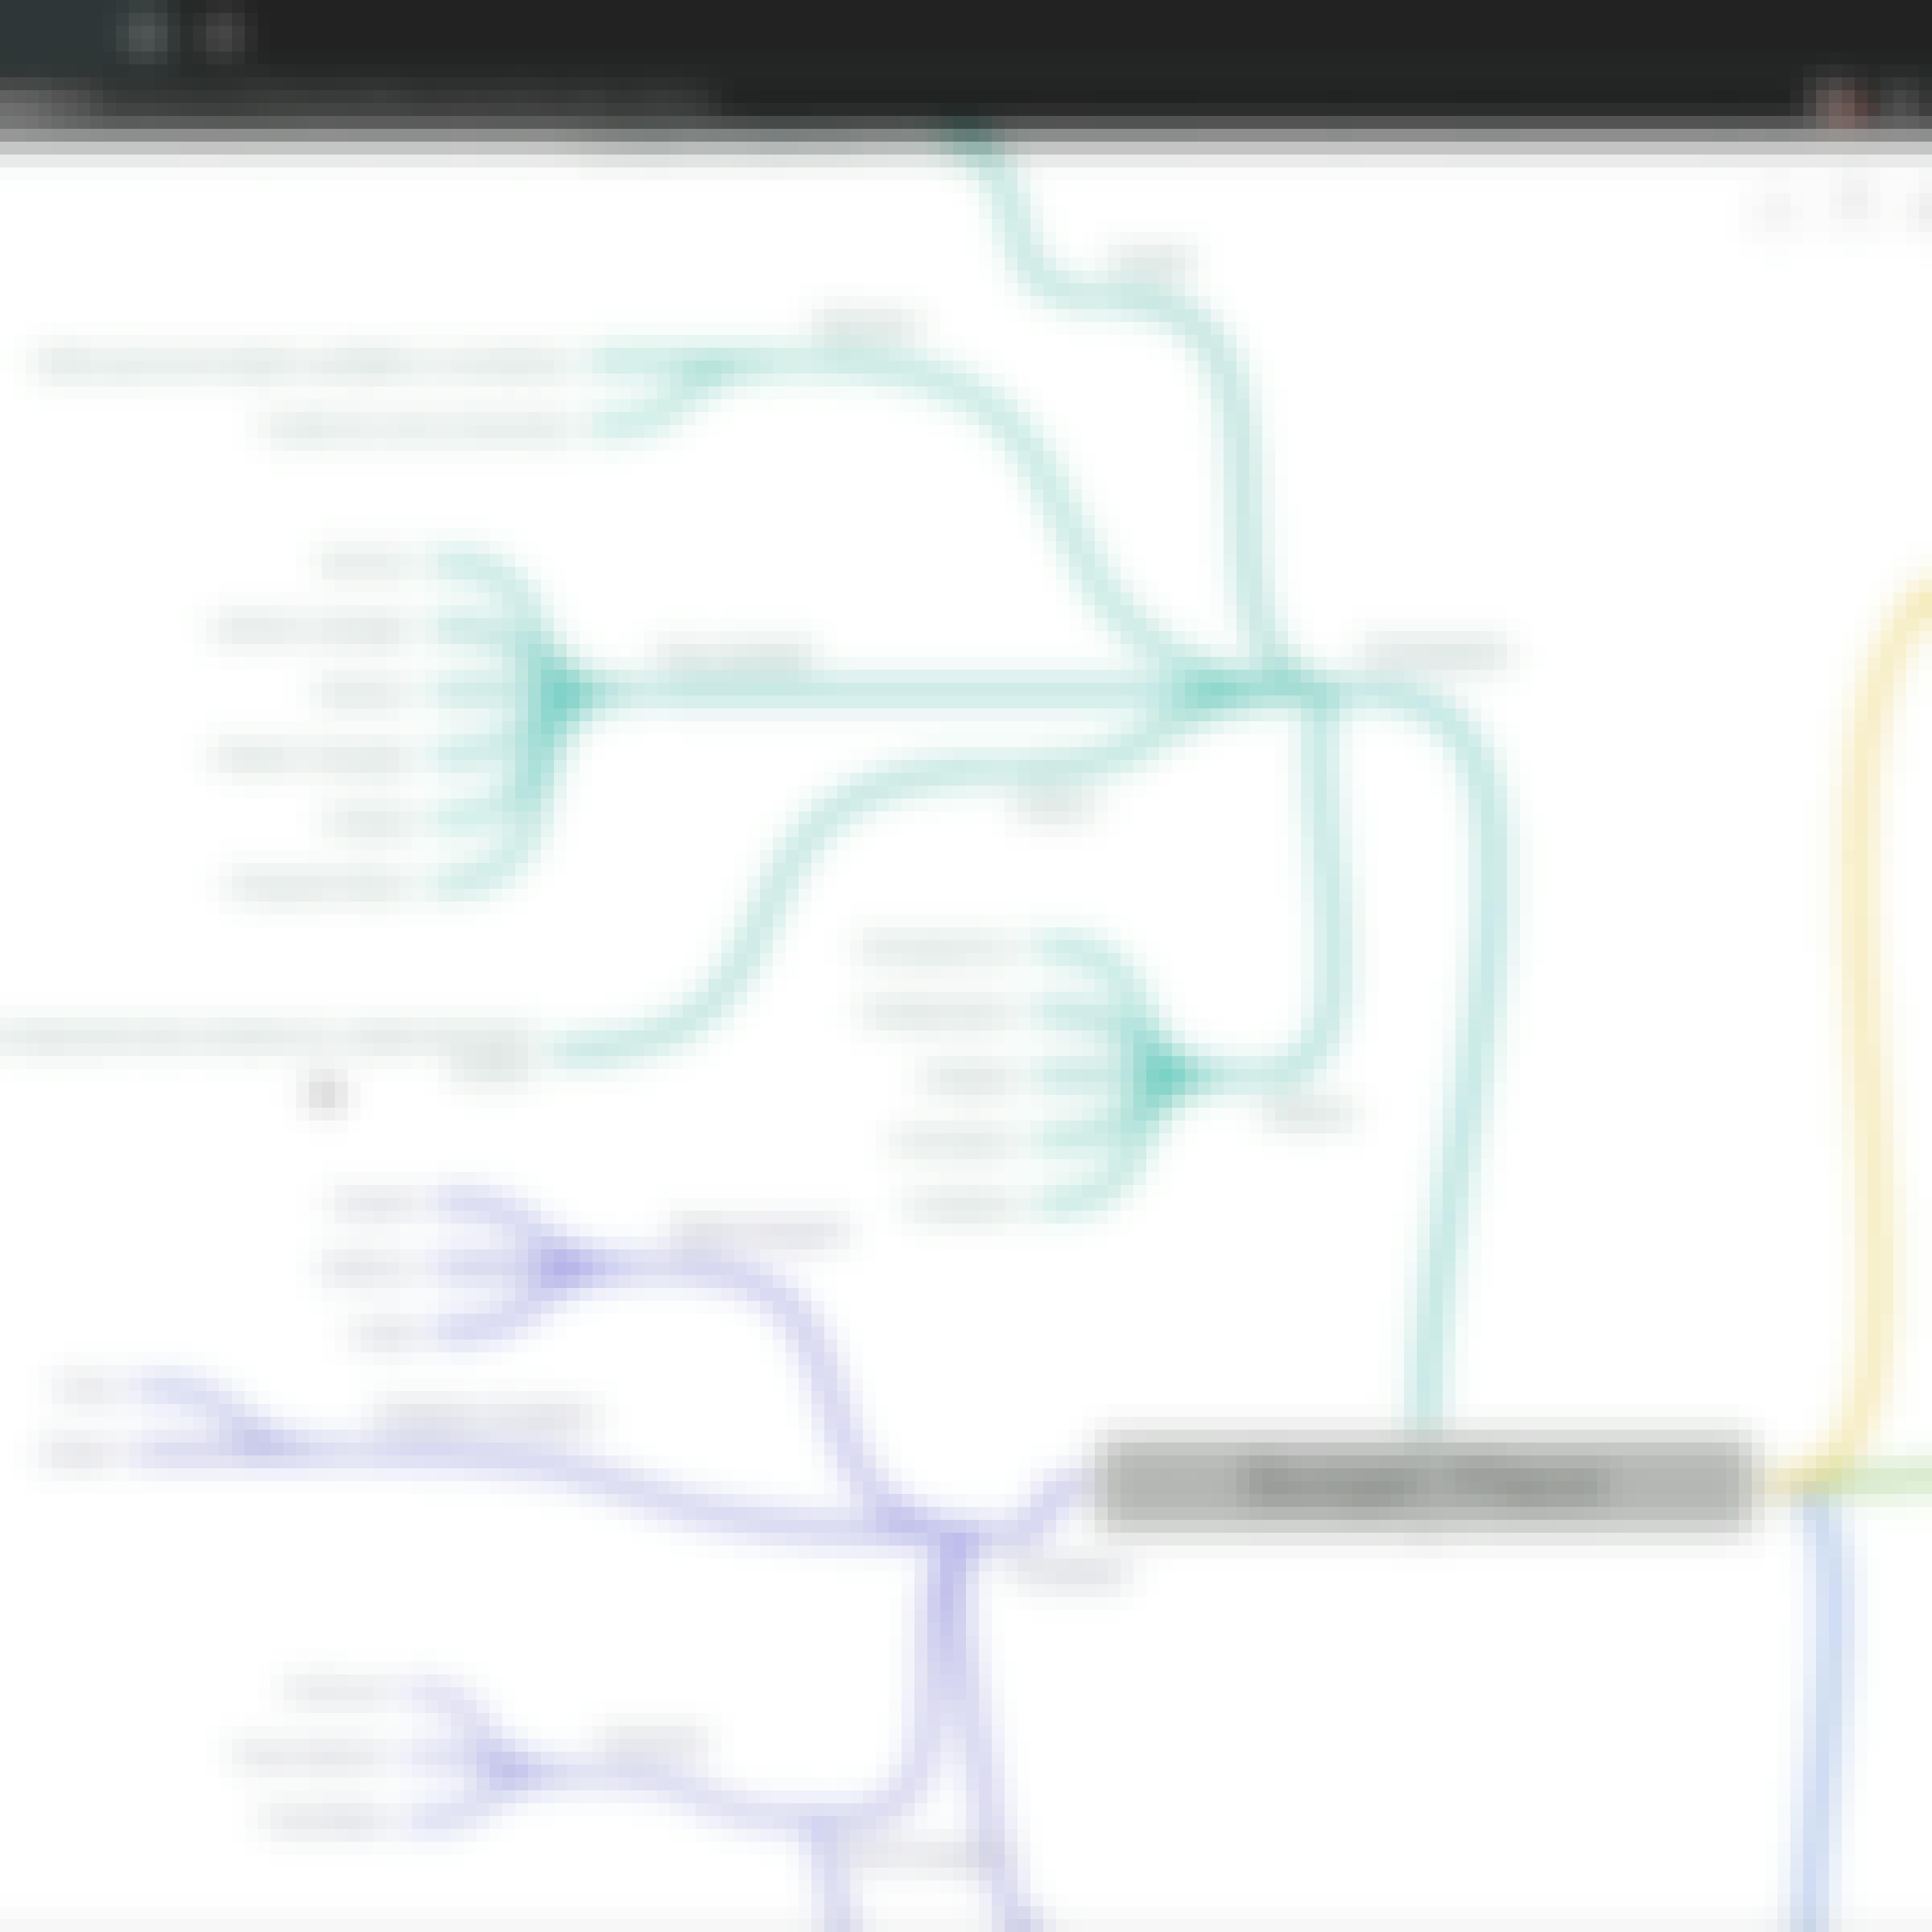
- Use Canva to Create an Interactive Mind Map: Coursera Project Network
- Create a business mind map with Coggle: Coursera Project Network
- Overview of Data Visualization: Coursera Project Network
- Applied Plotting, Charting & Data Representation in Python: University of Michigan
- Introduction to GIS Mapping: University of Toronto


