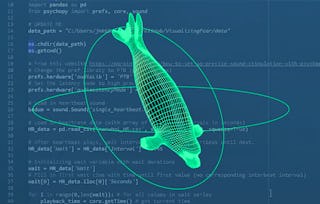
This course is an introduction to 3D scientific data visualization, with an emphasis on science communication and cinematic design for appealing to broad audiences. You will develop visualization literacy, through being able to interpret/analyze (read) visualizations and create (write) your own visualizations.

3D Data Visualization for Science Communication

3D Data Visualization for Science Communication


Instructors: Kalina Borkiewicz
Access provided by Lam Research
4,996 already enrolled
Gain insight into a topic and learn the fundamentals.
Beginner level
No prior experience required
3 weeks to complete
at 10 hours a week
Flexible schedule
Learn at your own pace
Skills you'll gain
Tools you'll learn
Details to know

Shareable certificate
Add to your LinkedIn profile
Taught in English
See how employees at top companies are mastering in-demand skills

There are 6 modules in this course
Instructors
Offered by


Why people choose Coursera for their career

Felipe M.
Learner since 2018
"To be able to take courses at my own pace and rhythm has been an amazing experience. I can learn whenever it fits my schedule and mood."

Jennifer J.
Learner since 2020
"I directly applied the concepts and skills I learned from my courses to an exciting new project at work."

Larry W.
Learner since 2021
"When I need courses on topics that my university doesn't offer, Coursera is one of the best places to go."

Chaitanya A.
"Learning isn't just about being better at your job: it's so much more than that. Coursera allows me to learn without limits."
Explore more from Data Science
University of California, Santa Cruz

Illinois Tech
University of Colorado Boulder

¹ Some assignments in this course are AI-graded. For these assignments, your data will be used in accordance with Coursera's Privacy Notice.