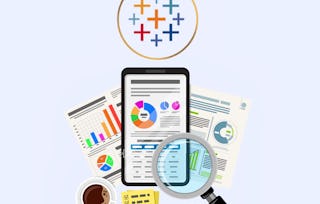
One of the skills that characterizes great business data analysts is the ability to communicate practical implications of quantitative analyses to any kind of audience member. Even the most sophisticated statistical analyses are not useful to a business if they do not lead to actionable advice, or if the answers to those business questions are not conveyed in a way that non-technical people can understand.

Data Visualization and Communication with Tableau

Data Visualization and Communication with Tableau
This course is part of Excel to MySQL: Analytic Techniques for Business Specialization


Instructors: Daniel Egger
Access provided by Yeditepe University
228,127 already enrolled
Gain insight into a topic and learn the fundamentals.
3,218 reviews
3 weeks to complete
at 10 hours a week
Flexible schedule
Learn at your own pace
95%
Most learners liked this course
Skills you'll gain
- Data Visualization
- Visualization (Computer Graphics)
- Oral Expression
- Analysis
- Dashboard Creation
- Interactive Data Visualization
- Business Analytics
- Data Visualization Software
- Graphing
- Statistical Visualization
- Presentations
- Tableau Software
- Data Analysis
- Business Process
- Business Process Improvement
- Process Improvement
- Data Presentation
- Data Storytelling
- Stakeholder Communications
Tools you'll learn
Details to know

Shareable certificate
Add to your LinkedIn profile
Assessments
4 assignments
Taught in English
See how employees at top companies are mastering in-demand skills

Build your subject-matter expertise
This course is part of the Excel to MySQL: Analytic Techniques for Business Specialization
When you enroll in this course, you'll also be enrolled in this Specialization.
- Learn new concepts from industry experts
- Gain a foundational understanding of a subject or tool
- Develop job-relevant skills with hands-on projects
- Earn a shareable career certificate

There are 6 modules in this course
Earn a career certificate
Add this credential to your LinkedIn profile, resume, or CV. Share it on social media and in your performance review.
Instructors
Instructor ratings
(328 ratings)Offered by

Why people choose Coursera for their career

Felipe M.
Learner since 2018
"To be able to take courses at my own pace and rhythm has been an amazing experience. I can learn whenever it fits my schedule and mood."

Jennifer J.
Learner since 2020
"I directly applied the concepts and skills I learned from my courses to an exciting new project at work."

Larry W.
Learner since 2021
"When I need courses on topics that my university doesn't offer, Coursera is one of the best places to go."

Chaitanya A.
"Learning isn't just about being better at your job: it's so much more than that. Coursera allows me to learn without limits."
Learner reviews
- 5 stars
74.96%
- 4 stars
19.68%
- 3 stars
3.10%
- 2 stars
1.02%
- 1 star
1.21%
Showing 3 of 3218
RC
5.0
Reviewed on May 29, 2019
it is a very good course with a lot of work, but very good knowledge accumulate during this curse. I will use tableau in my audit missions in the audit report, Visualization section.
EV
5.0
Reviewed on Jan 21, 2021
Very good course. I thought that it would just cover the basics of Tableau but the course also enlights how to make great presentations and how to use the visualisation to its maximum potential
DC
4.0
Reviewed on Apr 26, 2016
I have loved this course and the videos have been amazing. This course has been fantastic for getting a foundation in understanding data analysis and the use of Tableau!
Explore more from Data Science
University of Colorado Boulder
University of Pennsylvania

Tableau Learning Partner