Gaussian Distribution: Definition, Formula, and How to Use It in Excel
Discover how the Gaussian distribution works, what the formula tells you, and how to create a bell curve in Excel.
![[Featured Image]: Three people sitting at a table look at a tablet showing data that reflects a Gaussian distribution.](https://d3njjcbhbojbot.cloudfront.net/api/utilities/v1/imageproxy/https://images.ctfassets.net/wp1lcwdav1p1/2yBsRWyWGRbmufiLLYoGAd/bd383a0e406c9d2701cdee0eedf52d54/GettyImages-1542835125-converted-from-jpg.webp?w=1500&h=680&q=60&fit=fill&f=faces&fm=jpg&fl=progressive&auto=format%2Ccompress&dpr=1&w=1000)
Key takeaways
A Gaussian distribution describes how data clusters around a mean in a symmetrical, bell-shaped curve.
A Gaussian distribution formula uses the mean and standard deviation to calculate the probability density of each value in a data set.
You can make a Gaussian distribution in Excel by entering your data, calculating the mean and standard deviation, creating bin values, and using the Histogram tool to plot the curve.
The Gaussian distribution helps you recognize patterns in data, apply common statistical methods correctly, and interpret results across fields from biology to marketing. Learn more about how the formula works, what sigma means, and how to make a Gaussian distribution in Excel. If you're ready to start expanding your data analysis skills, enroll in the IBM Data Analyst Professional Certificate to work with data analysis tools, including Excel spreadsheets and Python libraries. Upon completion, you will receive a certificate to add to your resume.
What is a Gaussian distribution?
A Gaussian distribution is a way of describing how data spreads out around an average value, with most values clustering near the center and fewer appearing as you move toward the extremes. You'll also hear this called a normal distribution, bell curve, or normal curve, since a graph of the data forms a symmetrical bell-shaped curve around the mean.
Imagine you've baked a batch of 100 cookies. If the average weight is 50 grams with a standard deviation of two grams, most of the cookies will weigh between 48 and 52 grams. Fewer cookies will weigh less than 48 or more than 52.
The Gaussian distribution formula
The Gaussian distribution formula describes the relative density of values in a normally distributed data set. Two numbers define the distribution: the mean, which marks the center of the curve, and the standard deviation (or variance), which tells you how spread out the values are around that center.
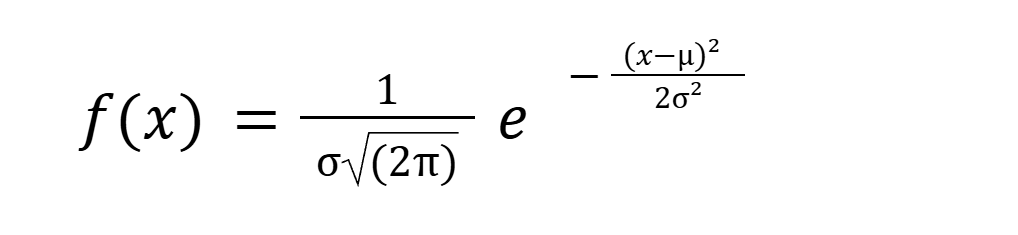
Each symbol in the formula represents the following:
𝓍: The value being evaluated
𝑓(𝓍): The probability density function (PDF) at a given value of 𝓍
𝜇: The mean of the distribution
σ: The standard deviation
e: Euler's number, which is approximately equal to 2.718
𝜋: Pi, which is approximately 3.14159
Values near the mean (μ) have the highest probability density. As the distance between 𝓍 and the mean increases, the exponent in the formula becomes more negative and the value of 𝑓(𝓍) decreases. This creates the familiar bell-shaped curve associated with the normal distribution, where observations farther from the mean are less common than those near the center [1].
What is sigma in the Gaussian distribution?
In the Gaussian distribution, sigma (σ) represents the standard deviation, or the distance between the data point and the mean [2]. When the standard deviation decreases, the bell curve becomes taller and narrower since the data values are closer to the mean. As the standard deviation increases, the curve becomes wider and lower because the data values are farther from the mean.
What is the 68-95-99.7 rule?
In a Gaussian distribution, the 68-95-99.7 rule tells you what share of values you can expect within one, two, or three standard deviations from the mean. It's also called the empirical rule.
Approximately 68 percent of values fall within one standard deviation of the mean. 95 percent fall within two standard deviations, and 99.7 percent fall within three standard deviations. Values outside three standard deviations are rare [3].

Standard normal distribution (z-distribution)
A standard normal distribution, often referred to as the z-distribution, has a mean of zero and a standard deviation of one.
You can use the standard normal distribution to compare values across different datasets. Instead of working with raw values, you convert data into z-scores, which show how many standard deviations a value falls above or below the mean. A z-score of zero sits at the mean. Positive z-scores indicate the values above the mean, and negative z-scores indicate the values below it.
Because every standard normal distribution uses the same mean and standard deviation, statisticians, researchers, and analysts can apply it to calculate probabilities, conduct hypothesis tests, and compare results across studies [4].
Multivariate Gaussian distribution
A multivariate Gaussian distribution extends the Gaussian to multiple variables. Instead of describing the spread of a single variable, it captures how two or more variables behave together.
You can use this type of distribution when you need to analyze multiple related variables at the same time. For example, if you have height and weight data for the same group of people, a multivariate Gaussian distribution can help you examine the relationship between those two variables. In marketing analytics, you could use one to analyze how metrics like clicks, time on page, and conversions relate across users [5].
How to make a Gaussian distribution in Excel
Visualizing your data as a bell curve can help you quickly see whether it follows a Gaussian distribution, which matters for choosing the right statistical methods. Excel makes this possible with the AVERAGE and STDEV.S functions, along with the built-in Histogram tool. To make a Gaussian distribution in Excel, follow these steps:
Step 1: Enter your data
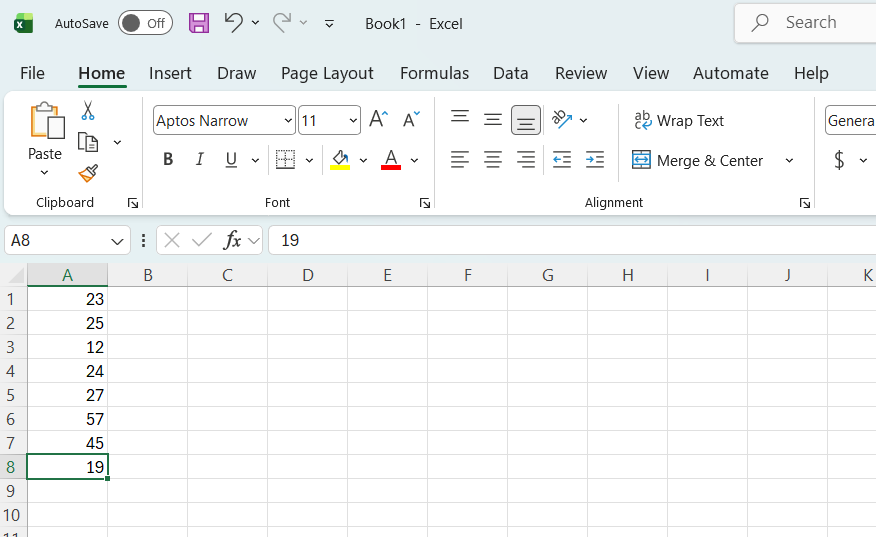
Place your data in a single column. In the following example, 23, 25, 12, 24, 27, 57, 45, and 19 are in column A.
Step 2: Calculate the mean and standard deviation
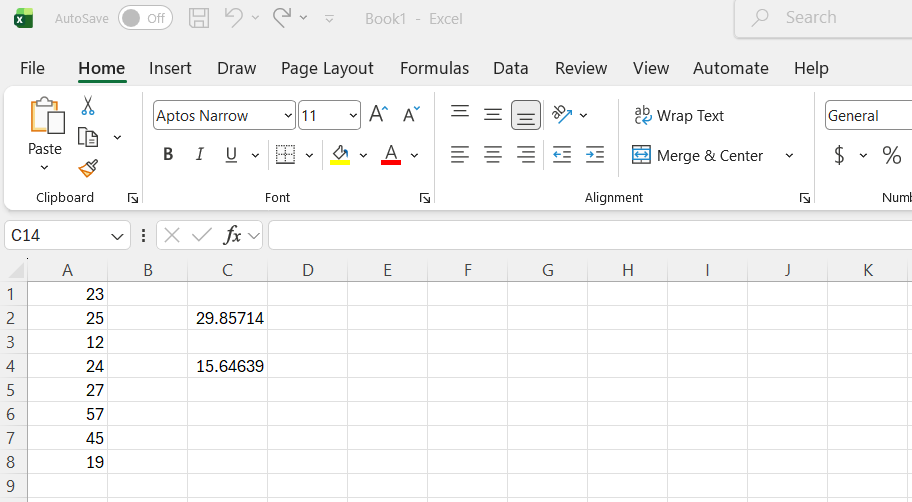
In an empty cell, calculate the mean (average) using the Excel function =AVERAGE(A1: A8). Calculate the standard deviation in another empty cell using the function =STDEV.S(A1: A8).
In the following example, C2 contains the calculated mean, and C4 has the calculated standard deviation.
Step 3: Create the bin values
Bins are categories that group data into ranges for the histogram. Excel uses these ranges to count the number of observations in each group.
In this example, the first bin starts three standard deviations below the mean. Each additional bin adds one standard deviation to create the next boundary.
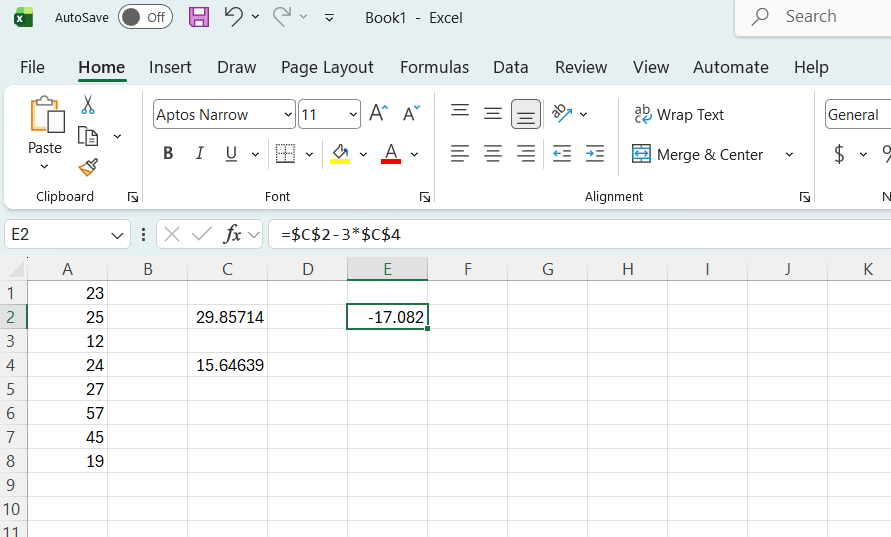
Create the next bin by adding one standard deviation to the previous bin value.
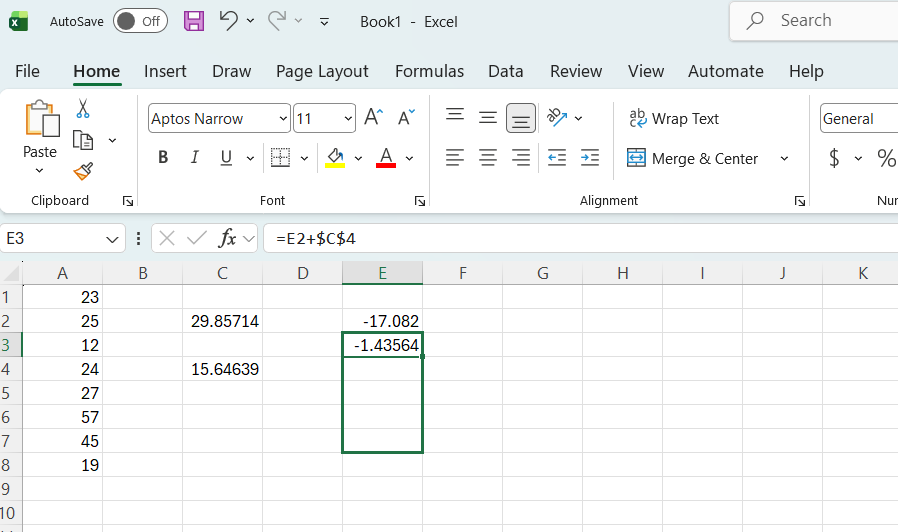
Fill the formula down to generate the remaining bin values.
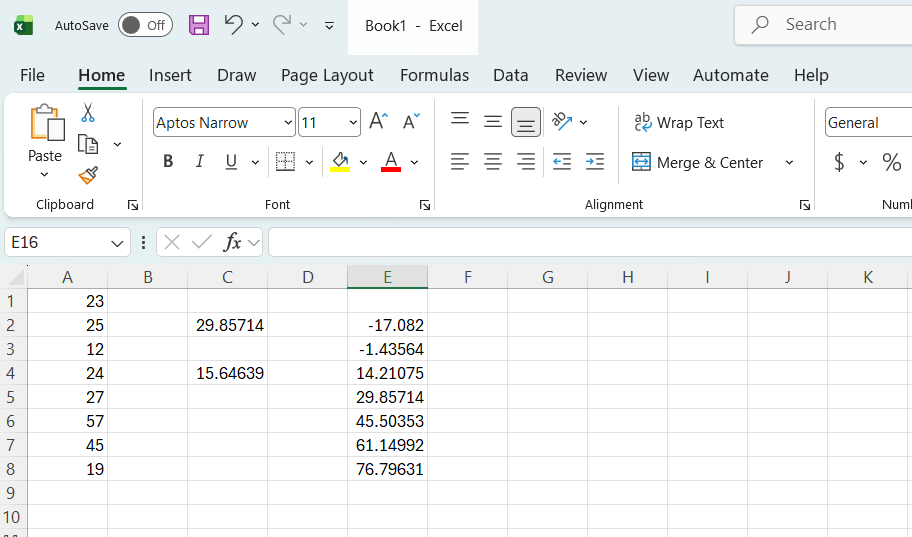
Step 4: Create the histogram
After creating the bins, you can use Excel's Histogram tool to group the data into ranges and visualize the distribution. If the data follows a Gaussian distribution, it should form a roughly symmetrical bell-shaped curve, centered around the mean.
How to tell if your data is Gaussian
To tell if your data is Gaussian, look for roughly symmetrical values clustered around the mean with fewer at the extremes. In a true Gaussian distribution, the mean, median, and mode are all equal. In real-world data, they're usually very close to one another. In that case, the data approximates rather than perfectly matches a bell curve, so treat these characteristics as guidelines rather than strict rules.
Why the Gaussian distribution matters
The Gaussian distribution serves as the foundation for many statistical methods used across fields like biology, manufacturing, and the social sciences. Confidence intervals, hypothesis testing, and some forms of regression analysis often rely on normality assumptions, such as normally distributed data, sampling distributions, or model errors. It also connects to the central limit theorem, which helps explain why averages from large samples often approximate a normal distribution.
Additionally, the 68-95-99.7 rule makes it easier to estimate probabilities and understand how data is distributed around the mean. This can help you identify typical values, recognize unusual observations, and interpret data more effectively.
Learn more: Regression Meaning: Definition, Examples, Uses
No-fluff help for when you're stuck
If you’re interested in expert guidance and no-fluff tips to help you build your skills, subscribe to our YouTube channel. Then build or refresh your data analysis skills with our other free resources:
Read our Career Chat issue: Using GenAI for Data Analysis
Save for later: Excel Terms and Definitions
Hear from a pro: 7 Questions with a Data Analytics Professor
Whether you want to develop a new skill, get comfortable with an in-demand technology, or advance your abilities, keep growing with a Coursera Plus subscription. You’ll get access to over 10,000 flexible courses.


Article sources
Investopedia. “Understanding Normal Distribution: Key Concepts and Financial Uses, https://www.investopedia.com/terms/n/normaldistribution.asp/.” Accessed July 7, 2026.
Keep reading
- July 30, 2026
- March 12, 2026
- January 31, 2026
- June 23, 2026
- May 30, 2026
- August 11, 2026
Coursera Staff
Editorial Team
Coursera’s editorial team is comprised of highly experienced professional editors, writers, and fact...
This content has been made available for informational purposes only. Learners are advised to conduct additional research to ensure that courses and other credentials pursued meet their personal, professional, and financial goals.