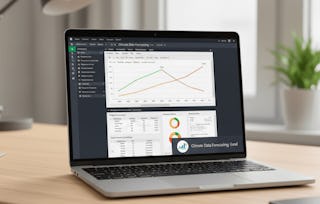
This course will give you practical experience in working with real-world data, with applications to important policy issues in today’s society. Each week, you will learn specific data handling skills in Excel and use these techniques to analyse climate change data, with appropriate readings to provide background information on the data you are working with. You will also learn about the consequences of climate change and how governments can address this issue.
After completing this course, you should be able to:
• Understand how data can be used to assess the extent of climate change
• Produce appropriate bar charts, line charts, and scatterplots to visualise data
• Calculate and interpret summary statistics (mean, median, variance, percentile, correlation)
• Explain the challenges with designing and implementing policies that address climate change
No prior knowledge in economics or statistics is required for this course. No knowledge of Excel is required, except a familiarity with the interface and how to enter and clear data.
This module explains why climate change is a serious global issue, and how we can use data to understand the extent of climate change.
What's included
6 readings1 assignment2 discussion prompts
Show info about module content
6 readings•Total 130 minutes
Introduction to climate change•20 minutes
Predicted and potential effects of climate change on lifestyles and the economy•15 minutes
Measuring temperature changes over long time periods•15 minutes
Excel: Plot a line chart of global temperatures from 1800-present•30 minutes
Excel: Visualising the extent of climate change•30 minutes
Additional reading for Week 1•20 minutes
1 assignment•Total 10 minutes
True or false?•10 minutes
2 discussion prompts•Total 40 minutes
How will climate change affect your country?•20 minutes
Describing the extent of climate change•20 minutes
Week 2
Module 2•4 hours to complete
Module details
This module explores the effect of climate change on temperature variability and extreme weather events, and explains how we can use statistical summary measures to document changes in temperature distributions over time.
Climate change: Effects on extreme weather events and temperature variability •15 minutes
Excel: Make frequency tables to summarise global temperatures in the decades 1950-2020•25 minutes
Excel: Make column charts to compare temperature distributions•20 minutes
Excel: Calculate percentiles of a distribution•25 minutes
Excel: Calculate the mean and variance of global temperatures•25 minutes
How can we address the effects of extreme weather events? •15 minutes
Additional reading for Week 2•15 minutes
1 assignment•Total 10 minutes
True or false?•10 minutes
5 discussion prompts•Total 80 minutes
How is climate change linked to extreme weather events?•15 minutes
How have extreme weather events affected your country?•20 minutes
Temperature distributions over time•15 minutes
Using summary measures to compare distributions•15 minutes
Adaption and mitigation•15 minutes
2 plugins•Total 30 minutes
Video: How to make a frequency table in Excel•15 minutes
Video: How to calculate percentiles in Excel•15 minutes
Week 3
Module 3•3 hours to complete
Module details
This module uses data to summarise the relationship between CO2 emissions and global temperatures, explains methods of identifying causal relationships between two variables, and discusses the problem of spurious correlation.
How carbon emissions in the atmosphere are measured•15 minutes
Excel: Make scatterplots and calculate the correlation coefficient•40 minutes
Correlation vs causation•25 minutes
How can social scientists identify causal relationships between variables?•30 minutes
Additional reading for Week 3•20 minutes
1 assignment•Total 10 minutes
True or false?•10 minutes
3 discussion prompts•Total 50 minutes
Correlation between CO2 emissions and temperature anomalies•15 minutes
Spurious correlations•15 minutes
The Montreal Protocol: Lessons for climate change•20 minutes
1 plugin•Total 15 minutes
Video: How to calculate the correlation coefficient and draw a scatterplot in Excel•15 minutes
Week 4
Module 4•4 hours to complete
Module details
This module explains how policymakers can use survey data and models to evaluate climate-related policies, and discusses the relationship between environmental policy and environmental quality.
What's included
7 readings2 assignments2 discussion prompts
Show info about module content
7 readings•Total 180 minutes
How much do people value the environment?•30 minutes
Excel: Green growth accounting•30 minutes
The challenge of assessing the consequences of climate change on future generations•25 minutes
Environmental policies and environmental quality around the world•30 minutes
Excel: Environmental impacts of food•40 minutes
Conclusion•10 minutes
Additional reading for Week 4•15 minutes
2 assignments•Total 40 minutes
True or false?•10 minutes
End-of-course assessment•30 minutes
2 discussion prompts•Total 30 minutes
Economic growth and environmental degradation•15 minutes
Environmental impacts of food•15 minutes
Instructors
Instructor ratings
Instructor ratings
We asked all learners to give feedback on our instructors based on the quality of their teaching style.
The University of London is a federal University which includes 17 world leading Colleges. With extensive experience in distance learning since 1858, University of London has enriched the lives of thousands of students, delivering high quality degrees across the globe. Today, University of London is a global leader in flexible study, offering degree programmes to over 45,000 students in over 190 countries, delivering world-leading research across the world. To find out more about University of London, visit www.london.ac.uk
Founded in 1826 in the heart of London, University College London is London's leading multidisciplinary university, with more than 13,000 staff and 42,000 students from 150 different countries. UCL counts 30 Nobel Prize winners amongst its academics and alumni and is consistently ranked in the global top 20 for its academic excellence and research.
We are a diverse global community with the freedom and courage to challenge, to question and to think differently. Through a progressive approach to teaching and research, our world leading academics, curious students and outstanding staff continually pursue excellence, break boundaries and make an impact on real world problems.
We are a global community of learners, teachers and researchers with a mission to transform the teaching of economics. We are doing so by developing free online textbooks and other resources for use in both formal education and by independent learners, giving everyone the tools to understand the economics of the world around them and some of the serious problems facing our societies, such as inequality, financial instability, environmental degradation, wealth creation and innovation. Now more than 115,000 students each year are taught using CORE, in over 368 universities in 61 countries, and in five languages.
When will I have access to the lectures and assignments?
To access the course materials, assignments and to earn a Certificate, you will need to purchase the Certificate experience when you enroll in a course. You can try a Free Trial instead, or apply for Financial Aid. The course may offer 'Full Course, No Certificate' instead. This option lets you see all course materials, submit required assessments, and get a final grade. This also means that you will not be able to purchase a Certificate experience.
What will I get if I purchase the Certificate?
When you purchase a Certificate you get access to all course materials, including graded assignments. Upon completing the course, your electronic Certificate will be added to your Accomplishments page - from there, you can print your Certificate or add it to your LinkedIn profile.
Is financial aid available?
Yes. In select learning programs, you can apply for financial aid or a scholarship if you can’t afford the enrollment fee. If fin aid or scholarship is available for your learning program selection, you’ll find a link to apply on the description page.