Results for "scatter plots"

Skills you'll gain: Plot (Graphics), Statistical Visualization, R (Software), Data Visualization Software, R Programming, Scatter Plots, Regression Analysis, Statistical Programming, Predictive Modeling, Artificial Neural Networks, Data Science, Deep Learning, Model Evaluation, Descriptive Statistics, Predictive Analytics, Statistical Methods, Data Wrangling, Data Manipulation, Machine Learning Methods, Model Training
Skills you'll gain: Classification And Regression Tree (CART), Minitab, Decision Tree Learning, Regression Analysis, Predictive Modeling, Statistical Modeling, Business Analytics, Statistical Methods, Advanced Analytics, Logistic Regression, Data-Driven Decision-Making, Scatter Plots, Plot (Graphics), Model Evaluation, Exploratory Data Analysis, Statistical Analysis, Case Studies, Responsible AI

University of Michigan
Skills you'll gain: Relational Databases, Data Visualization, Data Store, Web Scraping, Database Management, Scatter Plots, Data Manipulation, SQL, JSON, Application Programming Interface (API), Python Programming, Extensible Markup Language (XML), Hypertext Markup Language (HTML)

Skills you'll gain: Data Visualization, Data Presentation, Data Literacy, Statistical Visualization, Interactive Data Visualization, Data Visualization Software, Dashboard Creation, Dashboard, Scatter Plots, Data Analysis, Data Manipulation, Software Installation, Data Import/Export, Data Management

University of Colorado Boulder
Skills you'll gain: Predictive Modeling, Predictive Analytics, Model Evaluation, Exploratory Data Analysis, Logistic Regression, Data Presentation, Business Analytics, Analytics, Statistical Visualization, Statistical Modeling, Data-Driven Decision-Making, Regression Analysis, Classification And Regression Tree (CART), Data Analysis, Applied Machine Learning, Classification Algorithms, Data Analysis Software, Microsoft Excel, Data Preprocessing, Data Cleansing
Skills you'll gain: Unsupervised Learning, Microsoft Excel, Excel Formulas, Scatter Plots, Spreadsheet Software, Data Preprocessing, Data Visualization, Data Analysis, Data Manipulation, Feature Engineering, Applied Machine Learning, Model Evaluation

Skills you'll gain: Seaborn, Matplotlib, NumPy, Plot (Graphics), Scatter Plots, Statistical Visualization, Data Visualization Software, Box Plots, Histogram, Jupyter, Heat Maps, Graphing, Data Manipulation, AI Workflows, Development Environment, Python Programming

Ball State University
Skills you'll gain: Rmarkdown, Exploratory Data Analysis, Data Visualization Software, Ggplot2, Interactive Data Visualization, Plot (Graphics), Statistical Visualization, R (Software), R Programming, Data Storytelling, Histogram, Scatter Plots, Graphing, Data Analysis, Analysis, Color Theory

Maven Analytics
Skills you'll gain: Unsupervised Learning, Model Evaluation, Regression Analysis, Exploratory Data Analysis, Model Training, Applied Machine Learning, Time Series Analysis and Forecasting, Data Analysis, Model Optimization, Classification Algorithms, Statistical Analysis, Data Science, Machine Learning Methods, Forecasting, Statistical Methods, Data Preprocessing, Data Mining, Machine Learning, Supervised Learning, Business Intelligence

Rice University
Skills you'll gain: Data Literacy, Statistics, Descriptive Statistics, Probability & Statistics, Probability Distribution, Business Analytics, Statistical Methods, Microsoft Excel, Statistical Modeling, Data Analysis, Excel Formulas, Statistical Analysis, Descriptive Analytics, Box Plots, Sampling (Statistics), Statistical Inference, Correlation Analysis, Decision Making

Skills you'll gain: Exploratory Data Analysis, Matplotlib, Plot (Graphics), Box Plots, Data Analysis, Descriptive Statistics, Scatter Plots, Data Visualization Software, Histogram, Data Literacy, Statistical Visualization, Seaborn, Descriptive Analytics, Analytical Skills, Statistical Analysis, Correlation Analysis, Statistics

Skills you'll gain: Dashboard, Data Visualization Software, Data Visualization, Statistical Visualization, Plot (Graphics), Interactive Data Visualization, Data Presentation, Graphing, Data Preprocessing, Data Manipulation, Scatter Plots, Data Wrangling, Data Analysis, Data Modeling, Software Installation, Data Integration, Data Access
In summary, here are 10 of our most popular scatter plots courses
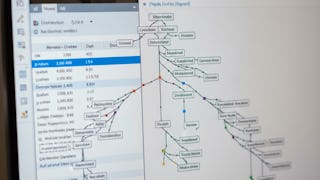
- Deep Learning with R: Build & Predict Neural Networks: EDUCBA
- Analyze Advanced Data Using Minitab Regression Models: EDUCBA
- Answering Interesting Questions with Data: University of Michigan
- Ace Salesforce Certified Tableau Desktop Foundations Exam: Packt
- Predictive Modeling and Analytics : University of Colorado Boulder
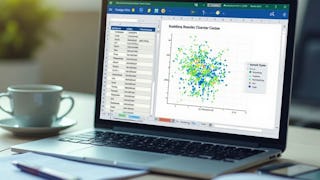
- Excel: Apply & Evaluate Unsupervised Clustering: EDUCBA
- AI Foundations with Python: Build & Visualize: EDUCBA
- Data Visualization: Ball State University
- Complete Visual Guide to Machine Learning: Maven Analytics
- Basic Data Descriptors, Statistical Distributions, and Application to Business Decisions: Rice University


