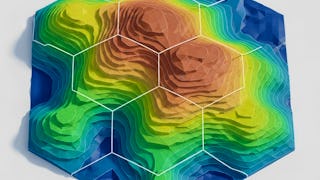
Cartography Courses
Cartography courses can help you learn map design, spatial analysis, data visualization, and geographic information systems (GIS). You can build skills in interpreting topographic features, understanding coordinate systems, and applying cartographic principles to create effective visual representations. Many courses introduce tools like ArcGIS and QGIS, that support analyzing geographic data and producing detailed maps that communicate information clearly.
Popular Cartography Courses and Certifications

Skills you'll gain: Wireframing, Web Content, Web Design, Information Architecture, Collaborative Software
Skills you'll gain: Unity Engine, User Interface (UI), UI Components, Visualization (Computer Graphics), Computer Graphics, Computer Graphic Techniques, Code Reusability, C# (Programming Language)

Skills you'll gain: Datamaps, Interactive Data Visualization, Data Visualization, Data Visualization Software, Statistical Visualization, Data Storytelling, Plot (Graphics), Data Access, Correlation Analysis, Exploratory Data Analysis, Data Preprocessing, Data Science, Data Analysis, Python Programming

Ball State University
Skills you'll gain: Rmarkdown, Exploratory Data Analysis, Data Visualization Software, Ggplot2, Interactive Data Visualization, Plot (Graphics), Statistical Visualization, R (Software), R Programming, Data Storytelling, Histogram, Scatter Plots, Graphing, Data Analysis, Analysis, Color Theory
In summary, here are 4 of our most popular cartography courses
- Build a Website Map with Jumpchart: Coursera
- Unity: Design & Build Procedural Hex Maps: EDUCBA
- Choisir la Meilleure Méthode pour Illustrer les Données: Coursera
- Data Visualization: Ball State University


