Data Analysis Excel Courses
Data Analysis Excel courses can help you learn data visualization, statistical analysis, and pivot table creation. You can build skills in data cleaning, trend identification, and creating dynamic dashboards. Many courses introduce tools like Excel functions, Power Query, and Power Pivot, which enhance your ability to manipulate and present data effectively. You'll also explore key topics such as data modeling, forecasting, and using formulas to automate calculations, all of which are crucial for making informed business decisions.
Popular Data Analysis Excel Courses and Certifications
 Status: Free Trial
University of Colorado Boulder
Skills you'll gain: Descriptive Statistics, Statistical Visualization, Data Transformation, Data Cleansing, Probability, Box Plots, Histogram, Probability Distribution, Probability & Statistics, Scatter Plots, Statistics, Microsoft Excel, Excel Formulas, Data Analysis, Statistical Methods, Spreadsheet Software, Bayesian Statistics
 Status: Free Trial
Tableau Learning Partner
Skills you'll gain: Exploratory Data Analysis, Tableau Software, Data Preprocessing, Plot (Graphics), Data Analysis, Descriptive Statistics, Predictive Analytics, Box Plots, Statistical Analysis, Scatter Plots, Data Visualization Software, Trend Analysis, Analytics, Histogram, Data Manipulation, Regression Analysis, Correlation Analysis
 Status: Preview
Knowledge Accelerators
Skills you'll gain: Prompt Engineering, Microsoft Copilot, Dashboard Creation, Excel Macros, Microsoft 365, Data Visualization, Pivot Tables And Charts, Spreadsheet Software, Productivity, AI literacy, Productivity Software, Data Analysis, Data-Driven Decision-Making, Workflow Management, Generative AI Agents, Artificial Intelligence, Customer Data Management, Generative AI, Data Management, Leadership Development
 Status: NewStatus: Free Trial
Skills you'll gain: Data Visualization, Dashboard Creation, Spreadsheet Software, Performance Reporting, Business Analytics, Business Reporting, Data Preprocessing
 Status: NewStatus: Free Trial
Logical Operations
Skills you'll gain: Key Performance Indicators (KPIs), Microsoft Excel, Data Presentation, Data Analysis Expressions (DAX), Data Integration, Performance Measurement, Pivot Tables And Charts, Data Visualization Software, Spreadsheet Software, Performance Reporting, Trend Analysis, Cloud-Based Integration, Time Series Analysis and Forecasting, Data Analysis, Data Modeling, Data Manipulation, Microsoft 365, Microsoft Office, Productivity Software
 Status: NewStatus: Free Trial
Logical Operations
Skills you'll gain: Pivot Tables And Charts, Microsoft Excel, Spreadsheet Software, Business Intelligence, Data Analysis, Data Analysis Software, Data Presentation, Microsoft Office, Microsoft 365, Data-Driven Decision-Making, Data Visualization, Trend Analysis, Productivity Software
 Status: Preview
Skills you'll gain: Data Analysis Expressions (DAX), Microsoft Excel, Excel Formulas, Spreadsheet Software, Data Processing, Data Presentation, Data Transformation, Data Analysis, Data Visualization, Data Integration, Statistical Analysis
 Status: NewStatus: Free Trial
Skills you'll gain: Pivot Tables And Charts, Trend Analysis, Financial Data, Microsoft Excel, Data Quality, Data Validation, Spreadsheet Software, Excel Formulas, Strategic Decision-Making, Data Synthesis, Financial Analysis, Analysis, Data Analysis, Data-Driven Decision-Making, Statistical Reporting, Data Analysis Software, Descriptive Statistics, Business Reporting, Data Integrity
 Status: NewStatus: Free Trial
Logical Operations
Skills you'll gain: Data Transformation, Microsoft Excel, Sampling (Statistics), Data Cleansing, Data Wrangling, Statistical Visualization, Data Analysis Software, Data Analysis, Statistical Analysis, Data Integration, Microsoft Office, Microsoft 365, Productivity Software
 Status: NewStatus: Free Trial
Skills you'll gain: Microsoft Excel, Excel Formulas, Pivot Tables And Charts, Financial Data, Financial Analysis, Cash Flows, Data-Driven Decision-Making, Data Manipulation
 Status: Preview
Simplilearn
Skills you'll gain: Microsoft Excel, Data Validation, Excel Formulas, Spreadsheet Software, Data Quality, Management Reporting, Pivot Tables And Charts, Data Cleansing, Project Management, Data Visualization Software, Business Reporting, Data Analysis, Timelines, Data Presentation, Graphing
 Status: Free Trial
Skills you'll gain: Data Visualization, Interactive Data Visualization, Data Presentation, Dashboard, Data Storytelling, Dashboard Creation, Data Visualization Software, Microsoft Excel, Spreadsheet Software, Graphing, Pivot Tables And Charts, Data Modeling, Database Development, Databases, Business Analysis Tools, Data Analysis, Simulation and Simulation Software, Data Analysis Software
In summary, here are 10 of our most popular data analysis excel courses
- Statistics and Data Analysis with Excel, Part 1: University of Colorado Boulder
- Data Analysis with Tableau: Tableau Learning Partner
- Microsoft Copilot in Excel: Smarter Data Analysis Made Easy: Knowledge Accelerators
- Analyze & Build Dashboards Using Excel Pivot Tables: EDUCBA
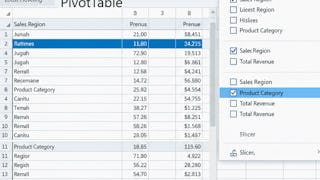
- Microsoft Excel: Data Analysis with Power Pivot: Logical Operations
- Microsoft Excel: Data Analysis with PivotTables: Logical Operations
- Excel Data Analysis and DAX Essentials Course: Simplilearn
- Validate and Summarize Data Effectively with Excel: Coursera
- Excel: Statistical Analysis and Data Transformation: Logical Operations
- Master Advanced Excel Functions to Analyze & Automate Data: EDUCBA


