• For Individuals
  • For Businesses
  • For Universities
  • For Governments
Degrees
​
Log In
Join for Free
  • Browse
  • Chart Js

Results for "chart.js"


  • Status: Free
    Free
    C

    Coursera

    Data Visualization using Plotly

    Skills you'll gain: Plotly, Exploratory Data Analysis, Scatter Plots, Plot (Graphics), Data Visualization, Data Visualization Software, Interactive Data Visualization, Data Analysis, Python Programming

    4
    Rating, 4 out of 5 stars
    ·
    51 reviews

    Intermediate · Guided Project · Less Than 2 Hours

  • C

    Coursera

    Introduction to D3.js

    Skills you'll gain: Data Visualization, Interactive Data Visualization, Visualization (Computer Graphics), JSON, Plot (Graphics), Data Mapping, Javascript

    3.7
    Rating, 3.7 out of 5 stars
    ·
    7 reviews

    Intermediate · Guided Project · Less Than 2 Hours

  • Status: Free
    Free
    C

    Coursera

    Presenting Data Using Charts with Canva

    Skills you'll gain: Presentations, Sales Presentations, Sales Presentation, Data Visualization, Productivity Software, Design

    4.4
    Rating, 4.4 out of 5 stars
    ·
    17 reviews

    Beginner · Guided Project · Less Than 2 Hours

  • Status: Free Trial
    Free Trial
    M

    Microsoft

    JavaScript Data and Applications

    Skills you'll gain: Performance Tuning, Development Testing, Software Testing, Unit Testing, Software Documentation, Application Programming Interface (API), Test Script Development, Code Reusability, Web Applications, Test Driven Development (TDD), Technical Documentation, Frontend Performance, Debugging, Performance Testing, Maintainability, Javascript, Software Design Patterns, Software Architecture, Secure Coding, Data Transformation

    Beginner · Course · 1 - 4 Weeks

  • Status: Free Trial
    Free Trial
    U

    University of Pennsylvania

    Data Viz Using Tableau & Presenting With Storytelling

    Skills you'll gain: Data Storytelling, Data Presentation, Data Visualization Software, Data Visualization, Tableau Software, Presentations, Storytelling, Technical Communication, Data Analysis, Stakeholder Communications, Spatial Analysis
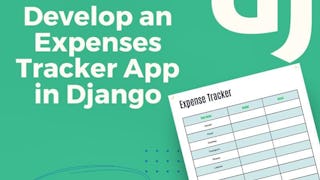
    Beginner · Course · 1 - 4 Weeks

  • C

    Coursera

    Real-time data visualization dashboard using Node-red

    Skills you'll gain: Dashboard Creation, Dashboard, Data Preprocessing, Interactive Data Visualization, Data Visualization Software, Real Time Data, Data Analysis, Application Programming Interface (API), No-Code Development, JSON, Javascript

    4.3
    Rating, 4.3 out of 5 stars
    ·
    18 reviews

    Intermediate · Guided Project · Less Than 2 Hours

  • C

    Coursera

    Create a Gantt Chart with Lucidchart

    Skills you'll gain: Timelines, Project Schedules, Scheduling, Project Management, Project Controls, Project Management Software, Project Planning, Coordinating, Dependency Analysis

    Beginner · Guided Project · Less Than 2 Hours

  • Status: Free
    Free
    C

    Coursera

    Create an Organizational Company Chart with Canva

    Skills you'll gain: Marketing Design, Organizational Structure, Diagram Design, Marketing Collateral, Graphic Design, Presentations, Dashboard, Collaborative Software

    4.8
    Rating, 4.8 out of 5 stars
    ·
    12 reviews

    Intermediate · Guided Project · Less Than 2 Hours

  • Status: Free
    Free
    C

    Coursera

    Data Visualization using Bokeh

    Skills you'll gain: Plot (Graphics), Spatial Data Analysis, Data Visualization Software, Data Visualization, Geospatial Mapping, Software Installation, Python Programming

    4.1
    Rating, 4.1 out of 5 stars
    ·
    16 reviews

    Intermediate · Guided Project · Less Than 2 Hours

  • P

    Packt

    JavaScript essentials for Node-RED

    Skills you'll gain: Code Reusability, Computational Logic

    Intermediate · Course · 1 - 3 Months

  • Status: New
    New
    P

    Packt

    Web Development Concepts for Everyone

    Skills you'll gain: Full-Stack Web Development, Version Control, Web Development, Cloud Deployment, Cloud Applications, OAuth, Web Development Tools, Database Management Systems, Devops Tools, Web Applications, Database Management, Software Development Tools, Bootstrap (Front-End Framework), Restful API, Web Services, Spring Framework, TypeScript, Application Deployment, Software Development, Application Development

    Intermediate · Course · 3 - 6 Months

  • Status: Free Trial
    Free Trial
    E

    EDUCBA

    Mastering Data Visualization with Matplotlib

    Skills you'll gain: Matplotlib, Data Storytelling, Data Presentation, Data Visualization, Plot (Graphics), Scientific Visualization, Data Visualization Software, Image Quality, Software Installation

    4.5
    Rating, 4.5 out of 5 stars
    ·
    15 reviews

    Mixed · Course · 1 - 4 Weeks

1…567…9

In summary, here are 10 of our most popular chart.js courses

  • Data Visualization using Plotly: Coursera
  • Introduction to D3.js: Coursera
  • Presenting Data Using Charts with Canva: Coursera
  • JavaScript Data and Applications: Microsoft
  • Data Viz Using Tableau & Presenting With Storytelling: University of Pennsylvania
  • Real-time data visualization dashboard using Node-red: Coursera
  • Create a Gantt Chart with Lucidchart: Coursera
  • Create an Organizational Company Chart with Canva: Coursera
  • Data Visualization using Bokeh: Coursera
  • JavaScript essentials for Node-RED: Packt

Other topics to explore

Arts and Humanities
338 courses
Business
1095 courses
Computer Science
668 courses
Data Science
425 courses
Information Technology
145 courses
Health
471 courses
Math and Logic
70 courses
Personal Development
137 courses
Physical Science and Engineering
413 courses
Social Sciences
401 courses
Language Learning
150 courses

Coursera Footer

Skills

  • Accounting
  • Artificial Intelligence (AI)
  • Cybersecurity
  • Data Analytics
  • Digital Marketing
  • Human Resources (HR)
  • Microsoft Excel
  • Project Management
  • Python
  • SQL

Professional Certificates

  • Google AI Certificate
  • Google Cybersecurity Certificate
  • Google Data Analytics Certificate
  • Google IT Support Certificate
  • Google Project Management Certificate
  • Google UX Design Certificate
  • IBM AI Engineering Certificate
  • IBM AI Product Manager Certificate
  • IBM Data Science Certificate
  • Intuit Academy Bookkeeping Certificate

Courses & Specializations

  • AI Essentials Specialization
  • AI For Business Specialization
  • AI For Everyone Course
  • AI in Healthcare Specialization
  • Deep Learning Specialization
  • Excel Skills for Business Specialization
  • Financial Markets Course
  • Machine Learning Specialization
  • Prompt Engineering for ChatGPT Course
  • Python for Everybody Specialization

Career Resources

  • Career Aptitude Test
  • CAPM Certification Requirements
  • CompTIA A+ Certification Requirements
  • CompTIA Security+ Certification Requirements
  • Essential IT Certifications
  • Free IT Certifications and Courses
  • High-Income Skills to Learn
  • How to Learn Artificial Intelligence
  • PMP Certification Requirements
  • Popular Cybersecurity Certifications

Coursera

  • About
  • What We Offer
  • Leadership
  • Careers
  • Catalog
  • Coursera Plus
  • Professional Certificates
  • MasterTrack® Certificates
  • Degrees
  • For Enterprise
  • For Government
  • For Campus
  • Become a Partner
  • Social Impact
  • Free Courses
  • Share your Coursera learning story

Community

  • Learners
  • Partners
  • Beta Testers
  • Blog
  • The Coursera Podcast
  • Tech Blog

More

  • Press
  • Investors
  • Terms
  • Privacy
  • Help
  • Accessibility
  • Contact
  • Articles
  • Directory
  • Affiliates
  • Modern Slavery Statement
  • Do Not Sell/Share
Learn Anywhere
Download on the App Store
Get it on Google Play
Logo of Certified B Corporation
© 2026 Coursera Inc. All rights reserved.
  • Coursera Facebook
  • Coursera Linkedin
  • Coursera Twitter
  • Coursera YouTube
  • Coursera Instagram
  • Coursera TikTok