Results for "data plotting"

Skills you'll gain: Seaborn, Plot (Graphics), Matplotlib, Scatter Plots, Statistical Visualization, Data Visualization, Data Presentation, Data Visualization Software, Box Plots, Descriptive Statistics, Exploratory Data Analysis, Statistical Analysis

Skills you'll gain: Matplotlib, Seaborn, Plot (Graphics), Scatter Plots, Histogram, Data Visualization, Data Visualization Software, Graphing, Statistical Visualization, Data Analysis, Python Programming

Macquarie University
Skills you'll gain: Excel Formulas, Microsoft Excel, Data Cleansing, Data Manipulation, Data Preprocessing, Data Wrangling, Data Processing, Spreadsheet Software, Data Transformation, Data Validation, Data Analysis, Automation
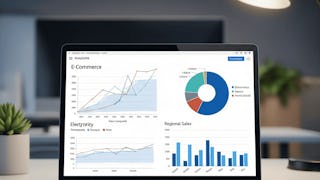
Skills you'll gain: Matplotlib, Plot (Graphics), Data Preprocessing, Box Plots, E-Commerce, Business Analytics, Data-Driven Decision-Making, Descriptive Statistics, Histogram, Data Analysis, Graphing, Statistical Visualization, Data Transformation, Scatter Plots, Exploratory Data Analysis, Software Installation

Skills you'll gain: Plot (Graphics), Pandas (Python Package), Data Visualization, Data Manipulation, Statistical Visualization, Data Processing, Data Import/Export, Regression Analysis

Johns Hopkins University
Skills you'll gain: Shiny (R Package), Dashboard Creation, Dashboard, Ggplot2, Interactive Data Visualization, Data Visualization Software, Application Development, Data Sharing, UI Components, User Interface (UI), Application Deployment

Macquarie University
Skills you'll gain: Data-Driven Decision-Making, Microsoft Excel, Forecasting, Regression Analysis, Data Literacy, Excel Formulas, Statistical Analysis, Data Analysis Software, Time Series Analysis and Forecasting, Spreadsheet Software, Analytics, Data Visualization, Statistical Methods, Data Analysis, Statistics, Statistical Hypothesis Testing, Probability & Statistics, Statistical Inference, Statistical Modeling, Variance Analysis
Logical Operations
Skills you'll gain: Data Transformation, Microsoft Excel, Sampling (Statistics), Data Cleansing, Data Wrangling, Statistical Visualization, Data Analysis Software, Data Analysis, Statistical Analysis, Data Integration, Microsoft Office, Microsoft 365, Productivity Software

Skills you'll gain: Statistical Visualization, Data Visualization Software, Data Visualization, Data Presentation, STATA (Software), Scatter Plots, Plot (Graphics), Box Plots, Exploratory Data Analysis, Histogram, Descriptive Statistics, Heat Maps, Graphing, Probability Distribution

Skills you'll gain: Matplotlib, Histogram, Plot (Graphics), Data Visualization, Seaborn, Scatter Plots, Data Visualization Software, Scientific Visualization, Interactive Data Visualization, Statistical Visualization, Exploratory Data Analysis, Graphing, Python Programming

Skills you'll gain: Exploratory Data Analysis, Box Plots, Plot (Graphics), Data Visualization, Ggplot2, Data Visualization Software, Statistical Visualization, Scatter Plots, Histogram, Data Analysis, Graphing, Python Programming

Duke University
Skills you'll gain: Data Visualization Software, Data Visualization, Data Storytelling, Interactive Data Visualization, Plot (Graphics), Plotly, Matplotlib, Data Presentation, Dashboard, Dashboard Creation, Seaborn, Tableau Software, Scatter Plots, Histogram, Google Sheets, Microsoft Excel, Data Analysis, Python Programming, Cloud Applications, Business Communication
In summary, here are 10 of our most popular data plotting courses
- Seaborn with Python: Data Visualization for Beginners: EDUCBA
- Python for Data Visualization:Matplotlib & Seaborn(Enhanced): Coursera
- Excel Fundamentals for Data Analysis: Macquarie University
- Matplotlib with Python: E-commerce Data Visualization: EDUCBA
- Python for Data Visualization - A Beginner's Guide: Packt
- Publishing Visualizations in R with Shiny and flexdashboard: Johns Hopkins University
- Statistics and Data Analysis with Excel: Advanced: Macquarie University
- Excel: Statistical Analysis and Data Transformation: Logical Operations
- Data Visualization in Stata: Packt
- Python for Data Visualization: Matplotlib & Seaborn: Coursera


