Results for "dashboard framework"

Skills you'll gain: Dashboard Creation, Google Sheets, Spreadsheet Software, Pivot Tables And Charts, Data Visualization, Data Analysis, Data Cleansing

Skills you'll gain: Test Automation, Test Script Development, Test Case, Selenium (Software), Software Testing, Test Tools, Maintainability, Code Reusability, Test Data, Debugging, Configuration Management

Skills you'll gain: Dashboard Creation, Data Storytelling, Dashboard, Market Data, Data-Driven Decision-Making, Tableau Software, Data Presentation, Financial Market, Interactive Data Visualization, Financial Data, Financial Analysis, Storytelling, Business Intelligence, Data Analysis, Data Visualization, Data Visualization Software, Analytics, Trend Analysis

Board Infinity
Skills you'll gain: Spring Framework, Java Programming, Java, Application Frameworks, Java Platform Enterprise Edition (J2EE), Maintainability, Scalability, Extensible Markup Language (XML)
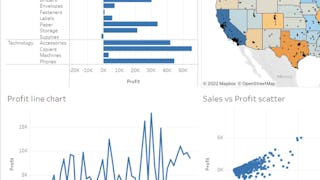
Skills you'll gain: Data Storytelling, Data Presentation, Data-Driven Decision-Making, Data Visualization, Interactive Data Visualization, Dashboard, Dashboard Creation, Data Visualization Software, Tableau Software, Exploratory Data Analysis

Skills you'll gain: Project Management Software, Dashboard, Project Schedules, Project Management, Calendar Management, Collaborative Software, Milestones (Project Management), Account Management
Skills you'll gain: Dashboard Creation, Dashboard, Data Preprocessing, Interactive Data Visualization, Data Visualization Software, Real Time Data, Data Analysis, Application Programming Interface (API), No-Code Development, JSON, Javascript
Logical Operations
Skills you'll gain: Data Storytelling, Data Presentation, Interactive Data Visualization, Dashboard, Datamaps, Data Visualization, Dashboard Creation, Microsoft Excel, Data Visualization Software, Pivot Tables And Charts, Geospatial Information and Technology, Spreadsheet Software, Geospatial Mapping, Data Analysis, Productivity Software, Microsoft Office, Microsoft 365
Logical Operations
Skills you'll gain: Power BI, Dashboard Creation, Dashboard, Collaborative Software, Collaboration, Data Sharing, Microsoft Power Platform, Microsoft Excel, Business Intelligence, Microsoft 365, Interactive Data Visualization, Microsoft PowerPoint, Microsoft Office, Data Analysis Software, Performance Tuning, Data Analysis
Skills you'll gain: Dashboard, Dashboard Creation, Data Visualization, Interactive Data Visualization, Data Presentation, Tableau Software, Data Visualization Software, Exploratory Data Analysis, Business Intelligence, Data Analysis

Skills you'll gain: Dashboard, Dashboard Creation, Data Presentation, Tableau Software, Data Visualization Software, Data Literacy, Descriptive Analytics, Data Import/Export

Skills you'll gain: Dashboard, Digital Marketing Tools, Data Visualization, Data Entry, Google Sheets, Spreadsheet Software, Management Reporting, Business Reporting, Marketing Analytics, Market Analysis, Query Languages, Digital Marketing, Data Management, Data Validation
In summary, here are 10 of our most popular dashboard framework courses
- Create Charts and Dashboard using Google Sheets: Coursera
- Building Test Automation Framework using Selenium and TestNG: Coursera
- Analyze Financial Markets with Tableau Dashboards: EDUCBA
- Mastering Spring Framework: Board Infinity
- Data Visualization in Tableau: Create Dashboards and Stories: Coursera
- Create a Project Management Dashboard using Bitrix24: Coursera
- Real-time data visualization dashboard using Node-red: Coursera
- Excel: Dashboards and Geospatial Visualizations: Logical Operations
- Power BI: Dashboards, Collaboration, and Optimization: Logical Operations
- Dynamic Dashboards with Tableau: Advanced Sales Analysis: Coursera


