• For Individuals
  • For Businesses
  • For Universities
  • For Governments
Degrees
​
Log In
Join for Free
  • Browse
  • Chart

Results for "chart"


  • C

    Coursera

    Power BI for Beginners: Interactive Dashboard Fundamentals

    Skills you'll gain: Key Performance Indicators (KPIs), Power BI, Dashboard Creation, Dashboard, Data Visualization, Interactive Data Visualization, Data Storytelling, Performance Metric, Business Metrics, Performance Analysis, Data Visualization Software, Data Import/Export, Business Intelligence, Regional Sales

    ★ 4.7 (80) · Beginner · Guided Project · Less Than 2 Hours

    Status: Free Trial
    Free Trial
    Category: Credit offered
    Credit offered
  • G

    Google Cloud

    Use Charts in Google Sheets

    Skills you'll gain: Data Visualization, Google Sheets, Data Visualization Software, Data Presentation, Pivot Tables And Charts, Spreadsheet Software, Google Workspace

    Advanced · Project · Less Than 2 Hours

    Category: Credit offered
    Credit offered
  • T

    Tally Education and Distribution Services Private Limited

    Fundamentals of Accounting and Reporting

    Skills you'll gain: Accounting, General Accounting, Accounting Systems, Ledgers (Accounting), Financial Reporting, Bookkeeping, Management Reporting, Accounting Software, Accounting Records, Financial Accounting, Business Reporting, Financial Statements, General Ledger, Data Entry, Inventory Accounting, Security Controls, Banking Services, Balance Sheet, Accounting and Finance Software, Banking

    ★ 4.6 (187) · Beginner · Course · 1 - 3 Months

    Status: Free Trial
    Free Trial
    Category: Credit offered
    Credit offered
  • C

    Coursera

    Visualize & Evaluate Financial Performance Reports

    Skills you'll gain: Performance Reporting, Business Reporting, Data Presentation, Financial Reporting, Management Reporting, Data Visualization, Data Storytelling, Financial Acumen, Performance Analysis, Case Studies, User Feedback, Constructive Feedback, Usability Testing, Communication

    Intermediate · Course · 1 - 4 Weeks

    Category: New
    New
    Status: Free Trial
    Free Trial
    Category: Credit offered
    Credit offered
  • C

    Coursera

    RStudio for Six Sigma - Control Charts

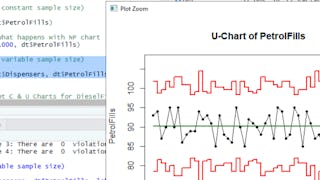
    Skills you'll gain: Statistical Process Controls, Six Sigma Methodology, Quality Control, Lean Six Sigma, Plot (Graphics), Quality Monitoring, Data Literacy, Statistical Analysis, R Programming

    Beginner · Guided Project · Less Than 2 Hours

    Category: Credit offered
    Credit offered
  • C

    Coursera

    Data Ingestion, Exploration & Visualization in Qlik Sense

    Skills you'll gain: Dashboard Creation, Data Visualization Software, Data Modeling, Dashboard, Data Wrangling, Interactive Data Visualization, Data Presentation, Data Storytelling, Data Transformation, Data Cleansing, Data Import/Export, Exploratory Data Analysis, Data Analysis, Key Performance Indicators (KPIs)

    ★ 4.9 (13) · Intermediate · Course · 1 - 4 Weeks

    Status: Free Trial
    Free Trial
    Category: Credit offered
    Credit offered
  • C

    Coursera

    Copilot for Beginners: Sales Data Analysis in Excel

    Skills you'll gain: Microsoft Copilot, Microsoft Excel, Data Cleansing, Data Visualization Software, Spreadsheet Software, Trend Analysis, Forecasting, Revenue Forecasting, Data Manipulation, Sales, Data Analysis, Prompt Engineering, Artificial Intelligence

    Beginner · Guided Project · Less Than 2 Hours

    Category: Credit offered
    Credit offered
  • C

    Coursera

    Overview of Data Visualization

    Skills you'll gain: Data Visualization, Data Literacy, Data Presentation, Google Sheets, Data Compilation, Data Visualization Software, Statistical Visualization, Graphing, Spreadsheet Software

    ★ 4.7 (461) · Beginner · Guided Project · Less Than 2 Hours

    Category: Free
    Free
    Status: Free Trial
    Free Trial
    Category: Credit offered
    Credit offered
  • P

    Packt

    Data Analytics and Visualization with Tableau and more

    Skills you'll gain: R Programming, Alteryx, R (Software), Statistical Programming, Tableau Software, Data Cleansing, Dashboard Creation, Data Visualization Software, Dashboard, Data Visualization, Data Storytelling, Interactive Data Visualization, Data Analysis Software, Data Structures, Statistical Analysis, Workflow Management, Data Analysis, Data Processing, Data Manipulation, Data Transformation

    Intermediate · Course · 1 - 4 Weeks

    Status: Free Trial
    Free Trial
    Category: Credit offered
    Credit offered
  • I

    Imperial College London

    Systematic Creative Thinking: Tools for Success

    Skills you'll gain: Brainstorming, Creative Problem-Solving, Ideation, Creative Thinking, Problem Solving, Creativity, Innovation, Analysis

    ★ 4.8 (64) · Intermediate · Course · 1 - 3 Months

    Status: Free Trial
    Free Trial
    Category: Credit offered
    Credit offered
  • C

    Coursera

    RF/Microwave Design - S-parameter Analysis

    Skills you'll gain: Electronic Systems, Simulation and Simulation Software, Electronics Engineering, electromagnetics, Communication Systems, Electrical Engineering, Telecommunications, Test Equipment, Electronics, Performance Testing, Electronic Components, Technical Design, Wireless Networks, Engineering Design Process, Simulations, Engineering Analysis, Design, Design and Product, Grant Applications, Data Management

    Intermediate · Course · 1 - 4 Weeks

    Category: New
    New
    Category: Preview
    Preview
    Category: Credit offered
    Credit offered
  • E

    Edureka

    Use Tableau for your Data Science Workflow

    Skills you'll gain: Data Presentation, Data Visualization, Plot (Graphics), Statistical Visualization, Data-Driven Decision-Making, Dashboard Creation, Data Ethics, R (Software), Data Science, Data Governance, Advanced Analytics

    Beginner · Course · 1 - 4 Weeks

    Category: Preview
    Preview
    Category: Credit offered
    Credit offered
1…789…25

In summary, here are 10 of our most popular chart courses

  • Power BI for Beginners: Interactive Dashboard Fundamentals: Coursera
  • Use Charts in Google Sheets: Google Cloud
  • Fundamentals of Accounting and Reporting: Tally Education and Distribution Services Private Limited
  • Visualize & Evaluate Financial Performance Reports: Coursera
  • RStudio for Six Sigma - Control Charts: Coursera
  • Data Ingestion, Exploration & Visualization in Qlik Sense: Coursera
  • Copilot for Beginners: Sales Data Analysis in Excel: Coursera
  • Overview of Data Visualization: Coursera
  • Data Analytics and Visualization with Tableau and more: Packt
  • Systematic Creative Thinking: Tools for Success: Imperial College London

Other topics to explore

Arts and Humanities
338 courses
Business
1095 courses
Computer Science
668 courses
Data Science
425 courses
Information Technology
145 courses
Health
471 courses
Math and Logic
70 courses
Personal Development
137 courses
Physical Science and Engineering
413 courses
Social Sciences
401 courses
Language Learning
150 courses

Coursera Footer

Skills

  • Accounting
  • Artificial Intelligence (AI)
  • Cybersecurity
  • Data Analytics
  • Digital Marketing
  • Human Resources (HR)
  • Microsoft Excel
  • Project Management
  • Python
  • SQL

Professional Certificates

  • Google AI Certificate
  • Google Cybersecurity Certificate
  • Google Data Analytics Certificate
  • Google IT Support Certificate
  • Google Project Management Certificate
  • Google UX Design Certificate
  • IBM AI Engineering Certificate
  • IBM AI Product Manager Certificate
  • IBM Data Science Certificate
  • Intuit Academy Bookkeeping Certificate

Courses & Specializations

  • AI Essentials Specialization
  • AI For Business Specialization
  • AI For Everyone Course
  • AI in Healthcare Specialization
  • Deep Learning Specialization
  • Excel Skills for Business Specialization
  • Financial Markets Course
  • Machine Learning Specialization
  • Prompt Engineering for ChatGPT Course
  • Python for Everybody Specialization

Career Resources

  • Career Aptitude Test
  • CAPM Certification Requirements
  • CompTIA A+ Certification Requirements
  • CompTIA Security+ Certification Requirements
  • Essential IT Certifications
  • Free IT Certifications and Courses
  • High-Income Skills to Learn
  • How to Learn Artificial Intelligence
  • PMP Certification Requirements
  • Popular Cybersecurity Certifications

Coursera

  • About
  • What We Offer
  • Leadership
  • Careers
  • Catalog
  • Coursera Plus
  • Professional Certificates
  • MasterTrack® Certificates
  • Degrees
  • For Enterprise
  • For Government
  • For Campus
  • Become a Partner
  • Social Impact
  • Free Courses
  • Share your Coursera learning story

Community

  • Learners
  • Partners
  • Beta Testers
  • Blog
  • The Coursera Podcast
  • Tech Blog

More

  • Press
  • Investors
  • Terms
  • Privacy
  • Help
  • Accessibility
  • Contact
  • Articles
  • Directory
  • Affiliates
  • Modern Slavery Statement
  • Do Not Sell/Share
Learn Anywhere
Download on the App Store
Get it on Google Play
Logo of Certified B Corporation
© 2026 Coursera Inc. All rights reserved.
  • Coursera Facebook
  • Coursera Linkedin
  • Coursera Twitter
  • Coursera YouTube
  • Coursera Instagram
  • Coursera TikTok