When you enroll in this course, you'll also be enrolled in this Specialization.
Learn new concepts from industry experts
Gain a foundational understanding of a subject or tool
Develop job-relevant skills with hands-on projects
Earn a shareable career certificate
There are 4 modules in this course
Learners will be able to analyze complex datasets, interpret advanced statistical outputs, and apply predictive modeling techniques using SPSS 2024. By the end of this course, learners will confidently evaluate relationships between variables, build and interpret regression models, and translate statistical results into actionable insights for business and healthcare contexts.
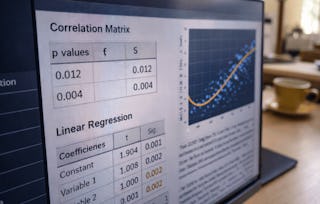
This course is designed to take learners beyond basic SPSS usage into advanced analytical thinking. Through real-world case studies—including market analysis, finance, home loans, and healthcare datasets—learners will apply descriptive analytics, correlation analysis, linear and multiple regression, logistic regression, and quadratic regression techniques. Each concept is reinforced with visual diagnostics such as scatter plots and residual analysis to ensure robust interpretation and model validation.
What makes this course unique is its strong emphasis on interpretation over computation. Rather than focusing solely on running SPSS commands, the course trains learners to understand why results occur and how to communicate insights effectively. The inclusion of end-to-end data preparation using both Excel and SPSS further ensures learners are industry-ready.
This course is ideal for students, analysts, and professionals who want to strengthen their data-driven decision-making skills using SPSS in practical, real-world scenarios.
This module introduces learners to advanced descriptive statistics and data visualization techniques in SPSS, enabling them to summarize, explore, and interpret business and healthcare datasets using numerical and graphical methods.
What's included
9 videos4 assignments
Show info about module content
9 videos•Total 92 minutes
Introduction to Course•13 minutes
Descriptive - Market Case Study•10 minutes
Descriptive - Graph - Market Summary•12 minutes
Descriptive - Charts - Diabetes Case Study•9 minutes
Introduction to Correlations•13 minutes
Example - Market Summary•9 minutes
Example - Market Summary Continued•8 minutes
Example - Diabetes•13 minutes
Correlations Matrix•5 minutes
4 assignments•Total 60 minutes
Graded - Advanced Descriptive Analytics & Data Exploration•30 minutes
This module builds analytical depth by exploring scatter plots, correlation insights, and simple linear regression models, focusing on understanding relationships and making predictions using SPSS.
What's included
9 videos4 assignments
Show info about module content
9 videos•Total 82 minutes
Tech Mahindra Output and Scatter Plots•9 minutes
Tech Mahindra Output and Scatter Plots Continued•8 minutes
More on Scatter Plots•8 minutes
Introduction to Linear Regressions•7 minutes
Example - LIC Outputs•13 minutes
Example - LIC Interpretations and Scatter Plots•11 minutes
Example - PI Ratio and Interest Change•14 minutes
Introduction to Multiple Regressions•3 minutes
Home Loan - Estimates•11 minutes
4 assignments•Total 60 minutes
Graded - Correlation Insights & Simple Linear Regression•30 minutes
Exploring Relationships with Scatter Plots•10 minutes
Introduction to Linear Regression Models•10 minutes
Regression Applications in Finance•10 minutes
Multiple Regression & Predictive Interpretation
Module 3•2 hours to complete
Module details
This module advances learners’ skills in multiple regression analysis, focusing on interpreting complex model outputs, evaluating predictor significance, and applying regression insights to healthcare and business scenarios.
This module equips learners with advanced regression techniques including logistic and quadratic regression, while emphasizing robust data preparation practices using SPSS and Excel to ensure accurate and reliable analysis.
What's included
6 videos3 assignments
Show info about module content
6 videos•Total 65 minutes
Interpretations•11 minutes
Introduction to Quadratic Regressions•6 minutes
Preparing Dataset Using SPSS•14 minutes
Preparing Dataset Using MS Excel•12 minutes
LIC Outputs and Interpretations•13 minutes
Quadratic Regressions Scatter Plots•9 minutes
3 assignments•Total 50 minutes
Graded - Advanced Regression Techniques & Data Preparation•30 minutes
Logistic Regression Interpretation•10 minutes
Data Preparation Across Tools•10 minutes
Earn a career certificate
Add this credential to your LinkedIn profile, resume, or CV. Share it on social media and in your performance review.
Welcome to EDUCBA, a place where knowledge is limitless! We provide a wide selection of instructive and engaging programmes designed to empower students of all ages and experiences. From the convenience of your home, start a revolutionary educational experience with our cutting-edge technologies courses and experienced instructors.
When will I have access to the lectures and assignments?
To access the course materials, assignments and to earn a Certificate, you will need to purchase the Certificate experience when you enroll in a course. You can try a Free Trial instead, or apply for Financial Aid. The course may offer 'Full Course, No Certificate' instead. This option lets you see all course materials, submit required assessments, and get a final grade. This also means that you will not be able to purchase a Certificate experience.
What will I get if I subscribe to this Specialization?
When you enroll in the course, you get access to all of the courses in the Specialization, and you earn a certificate when you complete the work. Your electronic Certificate will be added to your Accomplishments page - from there, you can print your Certificate or add it to your LinkedIn profile.
Is financial aid available?
Yes. In select learning programs, you can apply for financial aid or a scholarship if you can’t afford the enrollment fee. If fin aid or scholarship is available for your learning program selection, you’ll find a link to apply on the description page.