This course is intended for learners with some experience using Microsoft Windows, who are seeking to build presentation skills with Microsoft Excel. To be successful in this course you should have an understanding of the basics of using a Windows-based computer. Experience with printing and using a web browser are an asset, but not required.
Work Smarter with Microsoft Excel
Ends soon! Keep adding new skills with 10,000+ programs for $239 (usually $399). Save now.
Work Smarter with Microsoft Excel
This course is part of multiple programs.

Instructor: Microsoft
302,809 already enrolled
Included with
Ask Coursera
Gain insight into a topic and learn the fundamentals.
3,360 reviews
Beginner level
Recommended experience
Flexible schedule
2 weeks at 10 hours a week
Learn at your own pace
97%
Most learners liked this course
What you'll learn
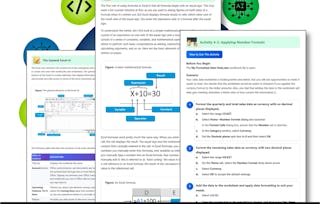
You will learn how to create a spreadsheet, work with formulas and functions, make your spreadsheets look professional, and print a spreadsheet.
How to manage worksheets, workbooks, tables table data, data cells and ranges, and charts
How to perform operations by using formulas and functions
Skills you'll gain
Tools you'll learn
Details to know

Shareable certificate
Add to your LinkedIn profile
Taught in English
See how employees at top companies are mastering in-demand skills

Build your subject-matter expertise
This course is available as part of
When you enroll in this course, you'll also be asked to select a specific program.
- Learn new concepts from industry experts
- Gain a foundational understanding of a subject or tool
- Develop job-relevant skills with hands-on projects
- Earn a shareable career certificate

Explore more from Business Essentials
Logical Operations
Logical Operations

Why people choose Coursera for their career

Felipe M.
Learner since 2018
"To be able to take courses at my own pace and rhythm has been an amazing experience. I can learn whenever it fits my schedule and mood."

Jennifer J.
Learner since 2020
"I directly applied the concepts and skills I learned from my courses to an exciting new project at work."

Larry W.
Learner since 2021
"When I need courses on topics that my university doesn't offer, Coursera is one of the best places to go."

Chaitanya A.
"Learning isn't just about being better at your job: it's so much more than that. Coursera allows me to learn without limits."
Learner reviews
- 5 stars
77.37%
- 4 stars
18.01%
- 3 stars
2.25%
- 2 stars
0.71%
- 1 star
1.63%
Showing 3 of 3360
ZW
Reviewed on Jul 21, 2023
For a Mac user like me, I need to figure out how do some features function on Mac myself and all contents are based on Windows version of Excel.
AX
Reviewed on Apr 9, 2022
This is a great course.  I am a first-time Excel user, but now I am much more confident in my newfound skills.  thank you, coursera.
MA
Reviewed on Mar 8, 2024
This course gives me more comprehensive insights to get along with Microsoft Excel apps. There are many implementation that I just knew from learning this course. It benefits me a lot. Thank you.


¹ Some assignments in this course are AI-graded. For these assignments, your data will be used in accordance with Coursera's Privacy Notice.