Ggplot2 Courses
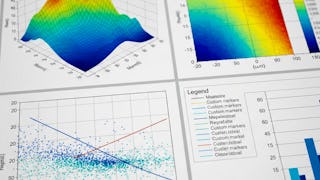
Ggplot2 courses can help you learn data visualization techniques, aesthetic mappings, and layering graphics to create informative plots. You can build skills in customizing visual elements, interpreting data distributions, and presenting complex datasets clearly. Many courses introduce tools like R and RStudio, that support implementing Ggplot2 effectively, along with methods for enhancing data storytelling through visual representation.
Popular Ggplot2 Courses and Certifications
 Status: Free Trial
 Status: NewStatus: Free Trial
 Status: Free Trial
 Status: NewStatus: Free Trial
 Status: NewStatus: Free Trial
 Status: Free Trial
University of Pittsburgh
 Status: Free Trial
University of Pennsylvania
 Status: Free Trial
University of Colorado Boulder


In summary, here are 10 of our most popular ggplot2 courses
- Simple Parallel Coordinates Plot using d3 js: Coursera
- Advanced Matplotlib: Design & Customize Visualizations: EDUCBA
- Apply C++ Graphics to Visualize Pandemic Population Data: EDUCBA
- Regression Analysis for Statistics & Machine Learning in R: Packt
- Share Data Through the Art of Visualization: Google
- Analyze Data Using R for Statistical and Predictive Modeling: EDUCBA
- Apply Quantitative Data Analysis Using R: EDUCBA
- Interactive, Geospatial & Narrative Data Visualization: University of Pittsburgh
- RStudio for Six Sigma - Control Charts: Coursera
- Build and deploy a stroke prediction model using R: Coursera


