Results for "chart+patterns"
 Status: NewStatus: Free Trial
Skills you'll gain: Data Visualization, C and C++, Computer Graphic Techniques, Graphing, Data Presentation
 Status: Free Trial
Skills you'll gain: Matplotlib, Plot (Graphics), Data Preprocessing, Box Plots, E-Commerce, Business Analytics, Data-Driven Decision-Making, Descriptive Statistics, Histogram, Data Analysis, Graphing, Statistical Visualization, Data Transformation, Scatter Plots, Exploratory Data Analysis, Software Installation
 Status: Free
Skills you'll gain: Presentations, Sales Presentations, Sales Presentation, Data Visualization, Productivity Software, Design
 Status: Free Trial
Skills you'll gain: Matplotlib, Scientific Visualization, Visualization (Computer Graphics), Plot (Graphics), Data Visualization, Data Visualization Software, Computer Graphics, Data Transformation, Typography

Google Cloud
Skills you'll gain: Data Visualization, Google Sheets, Data Visualization Software, Data Presentation, Pivot Tables And Charts, Spreadsheet Software, Google Workspace
 Status: NewStatus: Free Trial
Skills you'll gain: Data Processing, Data Wrangling, Advanced Analytics, Supply Chain Management, Data Transformation, Business Analytics, Statistical Visualization
 Status: Free
Skills you'll gain: Digital pedagogy, Education Software and Technology, Microsoft Office, Goal Setting, Educational Materials

Skills you'll gain: Statistical Visualization, Data Visualization Software, Data Visualization, Data Presentation, STATA (Software), Scatter Plots, Plot (Graphics), Box Plots, Exploratory Data Analysis, Histogram, Descriptive Statistics, Heat Maps, Graphing, Probability Distribution

Skills you'll gain: Timelines, Project Schedules, Scheduling, Project Management, Project Controls, Project Management Software, Project Planning, Coordinating, Dependency Analysis
 Status: NewStatus: Free Trial
Skills you'll gain: Splunk, Dashboard Creation, Data Transformation, Dashboard, Statistical Visualization, Data Visualization Software, Data Analysis, Statistical Analysis, Data Manipulation, Interactive Data Visualization, Scatter Plots, Data Presentation, Time Series Analysis and Forecasting, Event Monitoring, Security Information and Event Management (SIEM), Geospatial Mapping
 Status: Free Trial
University of Colorado Boulder
Skills you'll gain: Object Oriented Design, JUnit, Object Oriented Programming (OOP), Software Design Patterns, Software Engineering, Java, Unified Modeling Language, Software Design, Java Programming, Software Architecture, Model View Controller, Conceptual Design
 Status: New
Skills you'll gain: Software Design Patterns, System Design and Implementation, C and C++, Systems Design, Design Strategies
In summary, here are 10 of our most popular chart+patterns courses
- Create Sales Charts in C++ Using Graphics Programming: EDUCBA
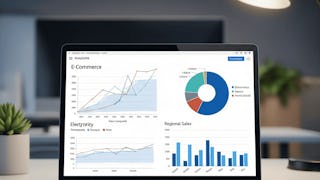
- Matplotlib with Python: E-commerce Data Visualization: EDUCBA
- Presenting Data Using Charts with Canva: Coursera
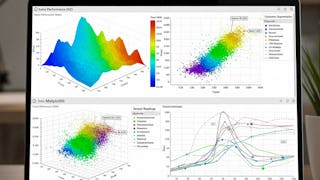
- Advanced Data Visualization with Matplotlib Mastery: EDUCBA
- Use Charts in Google Sheets: Google Cloud
- Analyze Supply Chain Demand Trends Using Heatmaps & Clusters: EDUCBA
- Use Microsoft PowerPoint to Create a Visual Schedule: Coursera
- Data Visualization in Stata: Packt
- Create a Gantt Chart with Lucidchart: Coursera
- Analyze and Visualize Data Using Splunk Statistics: EDUCBA


