
Filter by
The language used throughout the course, in both instruction and assessments.
851 results for "interactive dashboards"

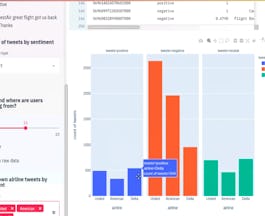
Skills you'll gain: Data Visualization, Plot (Graphics), Microsoft Excel, Statistical Visualization, Business Analysis, Data Analysis, Data Visualization Software, Interactive Data Visualization, Spreadsheet Software
 Status: Free
The University of Tokyo
Skills you'll gain: Computer Graphics, Algorithms
Coursera Project Network
Skills you'll gain: Computer Programming, Data Science, Data Visualization, Python Programming

Coursera Project Network
Skills you'll gain: Data Analysis, Microsoft Excel

Coursera Project Network
Coursera Project Network
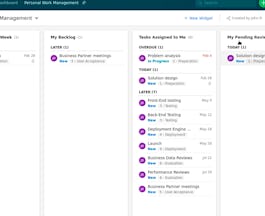
Skills you'll gain: Project Management

Skills you'll gain: Business Intelligence, Data Model, Data Visualization, Tableau Software
Coursera Project Network
Skills you'll gain: Data Visualization, Microsoft Excel, SQL

Coursera Project Network

University of California, Davis
Skills you'll gain: Data Visualization, Data Analysis, Data Analysis Software, Data Visualization Software, Tableau Software, Business Analysis, Business Intelligence, Statistical Visualization, Exploratory Data Analysis, Interactive Data Visualization, Interactive Design, Storytelling, Visual Design, Visualization (Computer Graphics), Plot (Graphics), Computer Graphics

Macquarie University
Skills you'll gain: Data Analysis, Data Management, Data Structures, Data Visualization, Data Visualization Software, Interactive Data Visualization, Interactive Design, Microsoft Excel, Spreadsheet Software, Visual Design
 Status: Free
Google Cloud
Skills you'll gain: Big Data, Data Analysis, Data Visualization, Exploratory Data Analysis
In summary, here are 10 of our most popular interactive dashboards courses
- Data Visualization and Dashboards with Excel and Cognos: IBM
- Interactive Computer Graphics: The University of Tokyo
- Create Interactive Dashboards with Streamlit and Python: Coursera Project Network
- Create Charts and Dashboards Using Microsoft Excel: Coursera Project Network
- Visualizing and Collaborating with Popplet: Coursera Project Network
- Create and manage a project dashboard with Wrike: Coursera Project Network
- Decisions, Decisions: Dashboards and Reports: Google
- Overview of Data Visualization: Coursera Project Network
- Support Interactive Learning with Genially: Coursera Project Network
- Data Visualization with Tableau: University of California, Davis


