• For Individuals
  • For Businesses
  • For Universities
  • For Governments
Degrees
​
Log In
Join for Free
  • Browse
  • Ggplot 2

Ggplot2 Courses

Ggplot2 courses can help you learn data visualization techniques, aesthetic mappings, and layering graphics to create informative plots. You can build skills in customizing visual elements, interpreting data distributions, and presenting complex datasets clearly. Many courses introduce tools like R and RStudio, that support implementing Ggplot2 effectively, along with methods for enhancing data storytelling through visual representation.


Popular Ggplot2 Courses and Certifications


  • Status: Free Trial
    Free Trial
    U

    University of Colorado Boulder

    Statistics and Data Analysis with Excel, Part 2

    Skills you'll gain: Statistical Hypothesis Testing, Statistical Analysis, Sampling (Statistics), Statistical Methods, Statistical Software, Microsoft Excel, Excel Formulas, Probability & Statistics, Data Analysis, Regression Analysis, Statistical Inference, Probability Distribution, Data Analysis Software, Statistical Modeling, Analysis, Probability

    5
    Rating, 5 out of 5 stars
    ·
    9 reviews

    Intermediate · Course · 1 - 3 Months

  • C

    Coursera

    Getting Started with R

    Skills you'll gain: R (Software), Data Import/Export, Package and Software Management, R Programming, Data Structures, Software Installation, Data Analysis Software, Data Analysis, Data Science

    4.3
    Rating, 4.3 out of 5 stars
    ·
    384 reviews

    Beginner · Guided Project · Less Than 2 Hours

  • P

    Packt

    Clustering and Classification with Machine Learning in R

    Skills you'll gain: Unsupervised Learning, Dimensionality Reduction, Supervised Learning, R Programming, Machine Learning Methods, Applied Machine Learning, R (Software), Classification Algorithms, Statistical Machine Learning, Data Wrangling, Machine Learning Algorithms, Tidyverse (R Package), Machine Learning, Data Science, Ggplot2, Classification And Regression Tree (CART), Feature Engineering, Machine Learning Software, Data Preprocessing, Statistical Programming

    Beginner · Course · 1 - 3 Months

  • C

    Coursera

    Crash Course on Interactive Data Visualization with Plotly

    Skills you'll gain: Plotly, Histogram, Interactive Data Visualization, Scatter Plots, Plot (Graphics), Data Visualization, Data Analysis, Python Programming

    4.8
    Rating, 4.8 out of 5 stars
    ·
    10 reviews

    Beginner · Guided Project · Less Than 2 Hours

  • Status: Free Trial
    Free Trial
    E

    EDUCBA

    Seaborn Python: Visualize & Analyze Data Distributions

    Skills you'll gain: Statistical Methods, Statistical Modeling, Descriptive Statistics

    Mixed · Course · 1 - 4 Weeks

  • C

    Coursera

    Building Statistical Models in R: Linear Regression

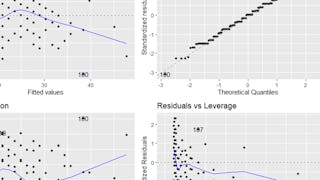
    Skills you'll gain: Exploratory Data Analysis, Statistical Modeling, Regression Analysis, Data Visualization, Model Evaluation, Data Analysis, Statistical Methods, Scatter Plots, Statistical Software, R Programming, Statistical Analysis, Plot (Graphics), R (Software), Ggplot2, Statistical Programming

    4.7
    Rating, 4.7 out of 5 stars
    ·
    20 reviews

    Beginner · Guided Project · Less Than 2 Hours

  • C

    Coursera

    Dashboard Development with Shiny: GenAI for Retail Analysis

    Skills you'll gain: Shiny (R Package), Interactive Data Visualization, Dashboard, Dashboard Creation, Data Visualization Software, R Programming, R (Software), Data Wrangling, User Interface (UI) Design, Ggplot2, Data Manipulation, Data Integration, Data Import/Export

    Intermediate · Guided Project · Less Than 2 Hours

  • Status: Free Trial
    Free Trial
    C

    Coursera

    Python for Data Visualization: Matplotlib & Seaborn

    Skills you'll gain: Matplotlib, Histogram, Plot (Graphics), Data Visualization, Seaborn, Scatter Plots, Data Visualization Software, Scientific Visualization, Interactive Data Visualization, Statistical Visualization, Exploratory Data Analysis, Graphing, Python Programming

    4.6
    Rating, 4.6 out of 5 stars
    ·
    78 reviews

    Beginner · Guided Project · Less Than 2 Hours

  • Status: Free Trial
    Free Trial
    E

    EDUCBA

    Mastering Data Visualization with Matplotlib

    Skills you'll gain: Matplotlib, Data Storytelling, Data Presentation, Data Visualization, Plot (Graphics), Scientific Visualization, Data Visualization Software, Image Quality, Software Installation

    4.5
    Rating, 4.5 out of 5 stars
    ·
    15 reviews

    Mixed · Course · 1 - 4 Weeks

  • C

    Coursera

    Interactive Statistical Data Visualization 101

    Skills you'll gain: Plotly, Data Visualization, Statistical Visualization, Box Plots, Interactive Data Visualization, Histogram, Statistical Analysis, Data Analysis, Probability

    4.9
    Rating, 4.9 out of 5 stars
    ·
    10 reviews

    Beginner · Guided Project · Less Than 2 Hours

  • C

    Coursera

    Calculating Descriptive Statistics in R

    Skills you'll gain: Descriptive Statistics, Data Analysis, Exploratory Data Analysis, Quantitative Research, R Programming, Statistical Analysis, Histogram, R (Software), Statistical Methods, Statistical Programming, Probability & Statistics, Descriptive Analytics, Statistics, Statistical Software, Data Science

    4.8
    Rating, 4.8 out of 5 stars
    ·
    52 reviews

    Beginner · Guided Project · Less Than 2 Hours

  • C

    Coursera

    Data Visualization & Storytelling in Python

    Skills you'll gain: Data Storytelling, Plotly, Data Presentation, Matplotlib, Interactive Data Visualization, Seaborn, Plot (Graphics), Data Visualization, Data Visualization Software, Statistical Visualization

    4.9
    Rating, 4.9 out of 5 stars
    ·
    9 reviews

    Beginner · Guided Project · Less Than 2 Hours

1…789…12

In summary, here are 10 of our most popular ggplot2 courses

  • Statistics and Data Analysis with Excel, Part 2: University of Colorado Boulder
  • Getting Started with R: Coursera
  • Clustering and Classification with Machine Learning in R: Packt
  • Crash Course on Interactive Data Visualization with Plotly: Coursera
  • Seaborn Python: Visualize & Analyze Data Distributions: EDUCBA
  • Building Statistical Models in R: Linear Regression: Coursera
  • Dashboard Development with Shiny: GenAI for Retail Analysis: Coursera
  • Python for Data Visualization: Matplotlib & Seaborn: Coursera
  • Mastering Data Visualization with Matplotlib: EDUCBA
  • Interactive Statistical Data Visualization 101: Coursera

Other topics to explore

Arts and Humanities
338 courses
Business
1095 courses
Computer Science
668 courses
Data Science
425 courses
Information Technology
145 courses
Health
471 courses
Math and Logic
70 courses
Personal Development
137 courses
Physical Science and Engineering
413 courses
Social Sciences
401 courses
Language Learning
150 courses

Coursera Footer

Skills

  • Accounting
  • Artificial Intelligence (AI)
  • Cybersecurity
  • Data Analytics
  • Digital Marketing
  • Human Resources (HR)
  • Microsoft Excel
  • Project Management
  • Python
  • SQL

Professional Certificates

  • Google AI Certificate
  • Google Cybersecurity Certificate
  • Google Data Analytics Certificate
  • Google IT Support Certificate
  • Google Project Management Certificate
  • Google UX Design Certificate
  • IBM AI Engineering Certificate
  • IBM AI Product Manager Certificate
  • IBM Data Science Certificate
  • Intuit Academy Bookkeeping Certificate

Courses & Specializations

  • AI Essentials Specialization
  • AI For Business Specialization
  • AI For Everyone Course
  • AI in Healthcare Specialization
  • Deep Learning Specialization
  • Excel Skills for Business Specialization
  • Financial Markets Course
  • Machine Learning Specialization
  • Prompt Engineering for ChatGPT Course
  • Python for Everybody Specialization

Career Resources

  • Career Aptitude Test
  • CAPM Certification Requirements
  • CompTIA A+ Certification Requirements
  • CompTIA Security+ Certification Requirements
  • Essential IT Certifications
  • Free IT Certifications and Courses
  • High-Income Skills to Learn
  • How to Learn Artificial Intelligence
  • PMP Certification Requirements
  • Popular Cybersecurity Certifications

Coursera

  • About
  • What We Offer
  • Leadership
  • Careers
  • Catalog
  • Coursera Plus
  • Professional Certificates
  • MasterTrack® Certificates
  • Degrees
  • For Enterprise
  • For Government
  • For Campus
  • Become a Partner
  • Social Impact
  • Free Courses
  • Share your Coursera learning story

Community

  • Learners
  • Partners
  • Beta Testers
  • Blog
  • The Coursera Podcast
  • Tech Blog

More

  • Press
  • Investors
  • Terms
  • Privacy
  • Help
  • Accessibility
  • Contact
  • Articles
  • Directory
  • Affiliates
  • Modern Slavery Statement
  • Do Not Sell/Share
Learn Anywhere
Download on the App Store
Get it on Google Play
Logo of Certified B Corporation
© 2026 Coursera Inc. All rights reserved.
  • Coursera Facebook
  • Coursera Linkedin
  • Coursera Twitter
  • Coursera YouTube
  • Coursera Instagram
  • Coursera TikTok