Results for "tkinter"

Skills you'll gain: Portfolio Management, Plotly, Data Visualization, Portfolio Risk, Interactive Data Visualization, Investment Management, Exploratory Data Analysis, Plot (Graphics), Return On Investment, Financial Modeling, Financial Analysis, Statistical Analysis, Statistical Methods, Financial Data, Financial Management, Risk Modeling, Market Data, Finance, Data Analysis, Python Programming

Skills you'll gain: Dashboard, Dashboard Creation, Data Visualization Software, ChatGPT, Data Visualization, Analytics, Interactive Data Visualization, Data Storytelling, Data Analysis, Python Programming, Generative AI, Debugging

Skills you'll gain: Debugging, Data Validation, Record Keeping, Programming Principles, Data Entry, Code Reusability
Skills you'll gain: GitHub Copilot, Object Oriented Design, Object Oriented Programming (OOP), Game Design, Unit Testing, Python Programming, AI Enablement, Program Development, GitHub, Development Environment, Debugging

Skills you'll gain: Frontend Integration, UI Components, User Interface (UI), MySQL, User Interface (UI) Design, Application Development, Database Application, User Flows, Application Deployment, Database Management, Application Design, Databases, SQL
Skills you'll gain: Exploratory Data Analysis, Plot (Graphics), Box Plots, Correlation Analysis, Data Visualization, Scatter Plots, Data Cleansing, Statistical Visualization, Data Preprocessing, Data Manipulation, Statistical Hypothesis Testing, Descriptive Statistics, Statistical Analysis, Data Analysis, Probability & Statistics, Statistical Methods, Python Programming
Skills you'll gain: Exploratory Data Analysis, Scatter Plots, Data Analysis, Correlation Analysis, Box Plots, Descriptive Statistics, Pandas (Python Package), Data Visualization, Plot (Graphics), Analysis, Histogram, Statistical Analysis, Python Programming, Software Installation

EDUCBA
Skills you'll gain: Event-Driven Programming, User Interface (UI), UI Components, User Interface (UI) Design, Interactive Data Visualization, Development Environment, Application Development, Software Installation, Data Entry

Skills you'll gain: Eclipse (Software), Data Structures, Video Game Development, Java Programming, Java, UI Components, Programming Principles, Game Design, User Interface (UI), Integrated Development Environments, Development Environment, Program Development

Skills you'll gain: Plot (Graphics), Pandas (Python Package), Data Visualization, Data Manipulation, Statistical Visualization, Data Processing, Data Import/Export, Regression Analysis

Google
Skills you'll gain: Package and Software Management, Data Science, Exploratory Data Analysis, Computer Programming, Mathematical Software

Skills you'll gain: Matplotlib, Data Storytelling, Data Presentation, Data Visualization, Plot (Graphics), Scientific Visualization, Data Visualization Software, Image Quality, Software Installation
In summary, here are 10 of our most popular tkinter courses
- Python for Finance: Beta and Capital Asset Pricing Model: Coursera
- Data Visualization with ChatGPT: Python for Dashboarding : Coursera
- Python Scripting Case Study - Creating a Console Application: EDUCBA
- Github Copilot with Python: Creating Text Games: Coursera
- Project on PyQt - Employee Management System: EDUCBA
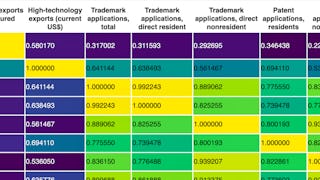
- Basic Statistics in Python (Correlations and T-tests): Coursera
- Análisis Exploratorio de Datos con Python: Coursera
- PySide2 Training: EDUCBA
- Build a Fast Typing Game using Java Swing: Coursera
- Python for Data Visualization - A Beginner's Guide: Packt


