Results for "chart+patterns"

Skills you'll gain: Tableau Software, Dashboard, Data Visualization Software, Data Visualization, R Programming, Alteryx, R (Software), Statistical Programming, Data Presentation, Data Literacy, Statistical Visualization, Interactive Data Visualization, Data Cleansing, Dashboard Creation, Plot (Graphics), Data Storytelling, Data Analysis Software, Data Structures, Statistical Analysis, Workflow Management

Skills you'll gain: Dashboard Creation, Google Sheets, Spreadsheet Software, Pivot Tables And Charts, Data Visualization, Data Analysis, Data Cleansing
University of Colorado Boulder
Skills you'll gain: Data Visualization Software, Interactive Data Visualization, Visualization (Computer Graphics), User Centered Design, Usability, Human Centered Design, Data Storytelling, Usability Testing, Quantitative Research, Design Elements And Principles

University of Colorado Boulder
Skills you'll gain: Data Mining, Anomaly Detection, Unsupervised Learning, Machine Learning Methods, Supervised Learning, Classification Algorithms, Decision Tree Learning, Machine Learning Algorithms, Data Analysis, Analysis, Machine Learning, Correlation Analysis, Bayesian Network, Algorithms, Artificial Neural Networks, Model Evaluation

Skills you'll gain: Timelines, Project Schedules, Google Sheets, Scheduling, Presentations, Data Visualization, Milestones (Project Management), Spreadsheet Software, Project Management
University of Colorado System
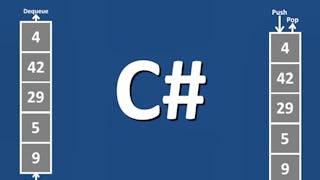
Skills you'll gain: Object Oriented Design, Object Oriented Programming (OOP), Unity Engine, Software Design Patterns, Data Structures, C# (Programming Language), Video Game Development, Software Design, Programming Principles, Graph Theory, Software Architecture, Algorithms

Dassault Systèmes
Skills you'll gain: Computer-Aided Design, Design Software, Technical Design, 3D Modeling, Mechanical Engineering

Skills you'll gain: Cloud Computing Architecture, Cloud Infrastructure, Scalability, Cloud Computing, Cloud Platforms, Software Architecture, Cloud Services, Cloud Deployment, Cloud Solutions, Infrastructure As A Service (IaaS), Load Balancing, Serverless Computing, Software Design Patterns, Microservices, Event-Driven Programming

Ball State University
Skills you'll gain: Rmarkdown, Exploratory Data Analysis, Data Visualization Software, Ggplot2, Interactive Data Visualization, Plot (Graphics), Statistical Visualization, R (Software), R Programming, Data Storytelling, Histogram, Scatter Plots, Graphing, Data Analysis, Analysis, Color Theory

Skills you'll gain: Data Storytelling, Data Visualization, Data Presentation, Matplotlib, Plotly, Seaborn, Plot (Graphics), Exploratory Data Analysis, Dashboard Creation

Dassault Systèmes
Skills you'll gain: SolidWorks (CAD), Technical Design, Design Software, Computer-Aided Design, 3D Modeling

Skills you'll gain: Time Series Analysis and Forecasting, Data Visualization, Statistical Visualization, Plot (Graphics), Data Preprocessing, Box Plots, Anomaly Detection, Plotly, Exploratory Data Analysis, Data Processing, Descriptive Analytics, Python Programming
In summary, here are 10 of our most popular chart+patterns courses
- Tableau Data Analysis and Visualization: Packt
- Create Charts and Dashboard using Google Sheets: Coursera
- Fundamentals of Data Visualization: University of Colorado Boulder
- Data Mining Methods: University of Colorado Boulder
- Create a Simple Gantt Chart using Google Sheets: Coursera
- Data Structures and Design Patterns for Game Developers: University of Colorado System
- SOLIDWORKS Feature Patterns and Sweeps: Dassault Systèmes
- Cloud Architecture Design Patterns: Coursera
- Data Visualization: Ball State University
- Python for Data Visualization and Analysis: Edureka


