Results for "plotly dash"
 Status: Hands-On Projects
Northeastern University
Skills you'll gain: Data Storytelling, Software Quality Assurance, Open Web Application Security Project (OWASP), Text Mining, Database Design, Agile Software Development, Software Development Life Cycle, Unsupervised Learning, Data Governance, Interactive Data Visualization, Software Architecture, Plotly, Cybersecurity, Classification Algorithms, PyTorch (Machine Learning Library), Statistical Hypothesis Testing, Java, Depreciation, Probability & Statistics, Cash Flows

Coursera
Skills you'll gain: Plotly, Exploratory Data Analysis, Scatter Plots, Plot (Graphics), Data Visualization, Data Visualization Software, Interactive Data Visualization, Python Programming

Skills you'll gain: Retrieval-Augmented Generation, OpenAI API, LLM Application, Prompt Engineering, Model Deployment, Back-End Web Development, Restful API, Application Programming Interface (API), Web Development, User Interface (UI)

Skills you'll gain: Competitive Analysis, Business Strategy, Market Analysis, Market Opportunities, Business Modeling, Entrepreneurship, Market Research, New Product Development, Innovation
 Status: Hands-On Projects
Northeastern University
Skills you'll gain: Data Storytelling, Text Mining, Data Warehousing, Unsupervised Learning, Database Design, Data Governance, Data Mining, Interactive Data Visualization, Generative AI, Web Scraping, Plotly, Classification Algorithms, PyTorch (Machine Learning Library), Operations Research, Supervised Learning, NoSQL, Database Theory, Exploratory Data Analysis, Time Series Analysis and Forecasting, Natural Language Processing
Skills you'll gain: Plotly, Dashboard, Pandas (Python Package), Data Manipulation, Interactive Data Visualization, Data Visualization Software, Data Visualization, Web Applications, Data Science, Data Analysis, Python Programming

Johns Hopkins University
Skills you'll gain: Shiny (R Package), Rmarkdown, Plotly, Interactive Data Visualization, Data Presentation, Data Visualization Software, R Programming, Data Mapping, Statistical Reporting, Software Documentation, Web Applications, Package and Software Management

Skills you'll gain: Technical Analysis, Time Series Analysis and Forecasting, Predictive Modeling, Market Data, Financial Forecasting, Applied Machine Learning, Trend Analysis, Financial Analysis, Data Visualization, Google Sheets, Interactive Data Visualization, Machine Learning, Data Manipulation, Data Import/Export
Skills you'll gain: Exploratory Data Analysis, Tree Maps, Geographic Information Systems, Plotly, Data Analysis, Data Visualization, Interactive Data Visualization, Data Visualization Software, Jupyter, Statistical Analysis, Pandas (Python Package)
Skills you'll gain: Sprint Planning, Jira (Software), Scrum (Software Development), User Story, Meeting Facilitation, Backlogs, Agile Methodology, Project Planning, Project Estimation, Agile Project Management, Estimation, Work Breakdown Structure, Workflow Management

Skills you'll gain: Exploratory Data Analysis, Seaborn, Plotly, Data Visualization, Data Visualization Software, Interactive Data Visualization, Data Analysis, Python Programming, Predictive Modeling, Data Science, Jupyter, Cloud Applications

Skills you'll gain: Plotly, Interactive Data Visualization, Data Visualization Software, Scatter Plots, Ggplot2, Data Analysis, Python Programming, Data Science, Machine Learning
In summary, here are 10 of our most popular plotly dash courses
- Master of Science in Engineering Management: Northeastern University
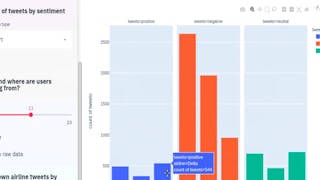
- Data Visualization using Plotly: Coursera
- GenAI Chatbots: Create and Deploy OpenAI-Powered Chatbots: Coursera
- Analyzing Market Attractiveness Using Creately: Coursera
- Master of Science in Data Analytics Engineering: Northeastern University
- Create Interactive Dashboards with Streamlit and Python: Coursera
- Developing Data Products: Johns Hopkins University
- Tesla Stock Price Prediction using Facebook Prophet: Coursera
- Exploratory vs Confirmatory data analysis using Python: Coursera
- Plan, Estimate, and Break Down Sprints: Coursera


