• For Individuals
  • For Businesses
  • For Universities
  • For Governments
Coursera
  • Coursera Plus
  • Log In
  • Join for Free
    Coursera
    • Browse
    • Excel Dashboard

    Excel Dashboard Courses Online

    Explore Excel dashboard creation for data presentation. Learn to design interactive dashboards using Excel tools and functions.

    Skip to search results

    Filter by

    Subject
    Required
     *

    Language
    Required
     *

    The language used throughout the course, in both instruction and assessments.

    Learning Product
    Required
     *

    Build job-relevant skills in under 2 hours with hands-on tutorials.
    Learn from top instructors with graded assignments, videos, and discussion forums.
    Learn a new tool or skill in an interactive, hands-on environment.
    Get in-depth knowledge of a subject by completing a series of courses and projects.
    Earn career credentials from industry leaders that demonstrate your expertise.
    Earn your Bachelor’s or Master’s degree online for a fraction of the cost of in-person learning.

    Level
    Required
     *

    Duration
    Required
     *

    Skills
    Required
     *

    Subtitles
    Required
     *

    Educator
    Required
     *

    Explore the Excel Dashboard Course Catalog

    • I

      IBM

      Data Visualization and Dashboards with Excel and Cognos

      Skills you'll gain: Data Storytelling, Data Visualization Software, Dashboard, IBM Cognos Analytics, Tree Maps, Scatter Plots, Pivot Tables And Charts, Microsoft Excel, Histogram

      4.7
      Rating, 4.7 out of 5 stars
      ·
      4.2K reviews

      Beginner · Course · 1 - 4 Weeks

    • Status: Free
      Free
      C

      Coursera Project Network

      Create Charts and Dashboards Using Microsoft Excel

      Skills you'll gain: Dashboard, Microsoft Excel, Microsoft 365, Spreadsheet Software, Data Visualization, Trend Analysis

      4.6
      Rating, 4.6 out of 5 stars
      ·
      918 reviews

      Intermediate · Guided Project · Less Than 2 Hours

    • M

      Macquarie University

      Excel Skills for Business

      Skills you'll gain: Microsoft Excel, Dashboard, Excel Formulas, Spreadsheet Software, Data Visualization, Excel Macros, Data Validation, Data Analysis Expressions (DAX), Data Cleansing, Data Modeling, Financial Forecasting, Predictive Modeling, Financial Modeling, Workflow Management, Finance, Data Management, Business Intelligence Software, Consolidation, Data Integrity, Data Entry

      4.9
      Rating, 4.9 out of 5 stars
      ·
      62K reviews

      Beginner · Specialization · 3 - 6 Months

    • Unlock Access to 10,000+ courses with a subscription.

      Learn more
    • P

      PwC

      Data Visualization with Advanced Excel

      Skills you'll gain: Data Presentation, Dashboard, Data Storytelling, Data Visualization Software, Microsoft Excel, Spreadsheet Software, Excel Formulas, Graphing, Pivot Tables And Charts, Data Modeling, Databases, Data Analysis, Simulation and Simulation Software

      4.8
      Rating, 4.8 out of 5 stars
      ·
      3K reviews

      Beginner · Course · 1 - 4 Weeks

    • M

      Macquarie University

      Excel Skills for Data Analytics and Visualization

      Skills you'll gain: Pivot Tables And Charts, Data Storytelling, Power BI, Excel Formulas, Data Analysis Expressions (DAX), Data Visualization Software, Interactive Data Visualization, Microsoft Excel, Spreadsheet Software, Dashboard, Data Modeling, Data Cleansing, Data Manipulation, Excel Macros, Infographics, Data Transformation, Data Analysis Software, Data Validation, Data Analysis, Microsoft Power Platform

      4.8
      Rating, 4.8 out of 5 stars
      ·
      5.7K reviews

      Intermediate · Specialization · 3 - 6 Months

    What brings you to Coursera today?

    • Status: Free
      Free
      K

      Knowledge Accelerators

      From Excel to Power BI

      Skills you'll gain: Power BI, Dashboard, Data Presentation, Data Visualization Software, Interactive Data Visualization, Data Import/Export, Business Intelligence, Microsoft Excel, Data Analysis, Data-Driven Decision-Making, Data Sharing, Data Modeling

      4.5
      Rating, 4.5 out of 5 stars
      ·
      1.3K reviews

      Beginner · Course · 1 - 4 Weeks

    • Status: Free
      Free
      C

      Coursera Project Network

      Introduction to Data Analysis using Microsoft Excel

      Skills you'll gain: Microsoft Excel, Excel Formulas, Spreadsheet Software, Pivot Tables And Charts, Data Analysis, Data Manipulation, Data Mining

      4.7
      Rating, 4.7 out of 5 stars
      ·
      3.9K reviews

      Intermediate · Guided Project · Less Than 2 Hours

    • Status: Free
      Free
      J

      Johns Hopkins University

      Business Analytics with Excel: Elementary to Advanced

      Skills you'll gain: Risk Modeling, Operations Research, Regression Analysis, Microsoft Excel, Business Analytics, Risk Analysis, Business Process Modeling, Business Modeling, Data Modeling, Resource Allocation, Statistical Analysis, Process Optimization, Financial Analysis, Predictive Analytics, Transportation Operations, Complex Problem Solving, Linear Algebra

      4.8
      Rating, 4.8 out of 5 stars
      ·
      3.7K reviews

      Intermediate · Course · 1 - 3 Months

    • M

      Macquarie University

      Data Visualization in Excel

      Skills you'll gain: Pivot Tables And Charts, Data Storytelling, Data Visualization Software, Interactive Data Visualization, Spreadsheet Software, Dashboard, Microsoft Excel, Excel Macros, Infographics, Data Analysis, Data Manipulation, Forecasting

      4.9
      Rating, 4.9 out of 5 stars
      ·
      1.2K reviews

      Intermediate · Course · 1 - 3 Months

    • Status: Free
      Free
      C

      Coursera Project Network

      Create Charts and Dashboard using Google Sheets

      Skills you'll gain: Dashboard, Google Sheets, Spreadsheet Software, Pivot Tables And Charts, Data Visualization Software, Data Presentation, Interactive Data Visualization, Excel Formulas, Data Manipulation

      4.6
      Rating, 4.6 out of 5 stars
      ·
      624 reviews

      Beginner · Guided Project · Less Than 2 Hours

    • I

      Illinois Tech

      A Comprehensive Excel Masterclass

      Skills you'll gain: Capital Budgeting, Data Visualization, Microsoft Excel, Dashboard, Business Intelligence, Interactive Data Visualization, Excel Formulas, Financial Analysis, Data Analysis Expressions (DAX), Pivot Tables And Charts, Key Performance Indicators (KPIs), Google Sheets, Business Analytics, Financial Modeling, Data-Driven Decision-Making, Loans, Cash Flows

      Build toward a degree

      4.8
      Rating, 4.8 out of 5 stars
      ·
      59 reviews

      Intermediate · Course · 1 - 4 Weeks

    • M

      Macquarie University

      Excel Skills for Business: Intermediate I

      Skills you'll gain: Microsoft Excel, Dashboard, Spreadsheet Software, Excel Formulas, Data Analysis Expressions (DAX), Data Visualization, Consolidation, Business Reporting, Data Management, Data Cleansing, Automation

      4.9
      Rating, 4.9 out of 5 stars
      ·
      17K reviews

      Intermediate · Course · 1 - 3 Months

    What brings you to Coursera today?

      Excel Dashboard learners also search

      Microsoft Excel
      Microsoft Excel Projects
      Advanced Microsoft Excel
      Excel VBA
      Analytics
      Business Intelligence
      Business Analytics
      Data Analysis Excel
      1234…81

      In summary, here are 10 of our most popular excel dashboard courses

      • Data Visualization and Dashboards with Excel and Cognos: IBM
      • Create Charts and Dashboards Using Microsoft Excel: Coursera Project Network
      • Excel Skills for Business: Macquarie University
      • Data Visualization with Advanced Excel: PwC
      • Excel Skills for Data Analytics and Visualization: Macquarie University
      • From Excel to Power BI: Knowledge Accelerators
      • Introduction to Data Analysis using Microsoft Excel: Coursera Project Network
      • Business Analytics with Excel: Elementary to Advanced: Johns Hopkins University
      • Data Visualization in Excel: Macquarie University
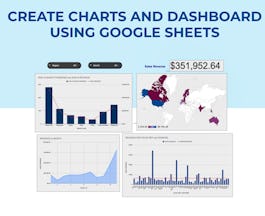
      • Create Charts and Dashboard using Google Sheets: Coursera Project Network

      Other topics to explore

      Arts and Humanities
      338 courses
      Business
      1095 courses
      Computer Science
      668 courses
      Data Science
      425 courses
      Information Technology
      145 courses
      Health
      471 courses
      Math and Logic
      70 courses
      Personal Development
      137 courses
      Physical Science and Engineering
      413 courses
      Social Sciences
      401 courses
      Language Learning
      150 courses

      Coursera Footer

      Technical Skills

      • ChatGPT
      • Coding
      • Computer Science
      • Cybersecurity
      • DevOps
      • Ethical Hacking
      • Generative AI
      • Java Programming
      • Python
      • Web Development

      Analytical Skills

      • Artificial Intelligence
      • Big Data
      • Business Analysis
      • Data Analytics
      • Data Science
      • Financial Modeling
      • Machine Learning
      • Microsoft Excel
      • Microsoft Power BI
      • SQL

      Business Skills

      • Accounting
      • Digital Marketing
      • E-commerce
      • Finance
      • Google
      • Graphic Design
      • IBM
      • Marketing
      • Project Management
      • Social Media Marketing

      Career Resources

      • Essential IT Certifications
      • High-Income Skills to Learn
      • How to Get a PMP Certification
      • How to Learn Artificial Intelligence
      • Popular Cybersecurity Certifications
      • Popular Data Analytics Certifications
      • What Does a Data Analyst Do?
      • Career Development Resources
      • Career Aptitude Test
      • Share your Coursera Learning Story

      Coursera

      • About
      • What We Offer
      • Leadership
      • Careers
      • Catalog
      • Coursera Plus
      • Professional Certificates
      • MasterTrack® Certificates
      • Degrees
      • For Enterprise
      • For Government
      • For Campus
      • Become a Partner
      • Social Impact
      • Free Courses
      • ECTS Credit Recommendations

      Community

      • Learners
      • Partners
      • Beta Testers
      • Blog
      • The Coursera Podcast
      • Tech Blog
      • Teaching Center

      More

      • Press
      • Investors
      • Terms
      • Privacy
      • Help
      • Accessibility
      • Contact
      • Articles
      • Directory
      • Affiliates
      • Modern Slavery Statement
      • Do Not Sell/Share
      Learn Anywhere
      Download on the App Store
      Get it on Google Play
      Logo of Certified B Corporation
      © 2025 Coursera Inc. All rights reserved.
      • Coursera Facebook
      • Coursera Linkedin
      • Coursera Twitter
      • Coursera YouTube
      • Coursera Instagram
      • Coursera TikTok