
Filter by
The language used throughout the course, in both instruction and assessments.
326 results for "plot (graphics)"

Coursera Project Network
Skills you'll gain: Data Analysis, Data Visualization, Microsoft Excel
Coursera Project Network
Coursera Project Network
Coursera Project Network
Skills you'll gain: Machine Learning

SkillUp EdTech
Skills you'll gain: Data Analysis, Exploratory Data Analysis, Problem Solving
 Status: Free
Coursera Project Network
Coursera Project Network
Skills you'll gain: Data Science, Deep Learning, Machine Learning, Tensorflow

Coursera Project Network

CompTIA
Skills you'll gain: Data Management

University of California, Davis

University of Houston
Skills you'll gain: Data Analysis, Mathematics, Microsoft Excel

Erasmus University Rotterdam
Skills you'll gain: Business Analysis, Data Analysis, Microsoft Excel, Spreadsheet Software
In summary, here are 10 of our most popular plot (graphics) courses
- Microsoft Excel تصور البيانات باستخدام: Coursera Project Network
- Introduction to Statistics in Python: Coursera Project Network
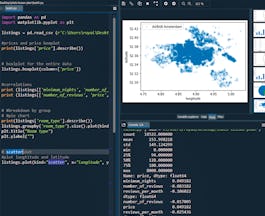
- Scatter Plot for Data Scientists & Big Data Analysts-Visuals: Coursera Project Network
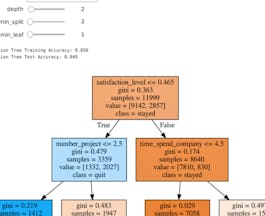
- Predict Employee Turnover with scikit-learn: Coursera Project Network
- The DMAIC Framework: Analyze, Improve, and Control Phase: SkillUp EdTech
- Dashboards in Qlik Sense: Decision-Support Dashboards: Coursera Project Network
- Creating Custom Callbacks in Keras: Coursera Project Network
- Play with Graphs using Wolfram Mathematica: Coursera Project Network
- CompTIA a+ Network: CompTIA
- Wine Tasting: Sensory Techniques for Wine Analysis: University of California, Davis


