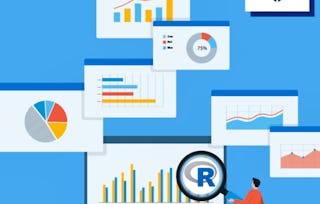
Data visualization is a critical skill for anyone that routinely using quantitative data in his or her work - which is to say that data visualization is a tool that almost every worker needs today. One of the critical tools for data visualization today is the R statistical programming language. Especially in conjunction with the tidyverse software packages, R has become an extremely powerful and flexible platform for making figures, tables, and reproducible reports. However, R can be intimidating for first time users, and there are so many resources online that it can be difficult to sort through without guidance.

Gain next-level skills with Coursera Plus for $199 (regularly $399). Save now.

Data Visualization in R with ggplot2
This course is part of Data Visualization & Dashboarding with R Specialization

Instructor: Collin Paschall
10,572 already enrolled
Included with
(130 reviews)
Skills you'll gain
Details to know

Add to your LinkedIn profile
See how employees at top companies are mastering in-demand skills

Build your subject-matter expertise
- Learn new concepts from industry experts
- Gain a foundational understanding of a subject or tool
- Develop job-relevant skills with hands-on projects
- Earn a shareable career certificate

There are 3 modules in this course
In this module, we will get started using ggplot2. You should begin by watching the introductory videos in each lesson. Then, carefully review the readings and reference materials provided. Once you have done that, I recommend watching the videos again to check your understanding. You will take a few quizzes as you progress through the material to make sure you are keeping up.
What's included
4 videos11 readings2 assignments1 peer review
In this module, we will continue working with ggplot, learning additional types of visualization techniques. You should begin by watching the introductory videos in each lesson. Then, carefully review the readings and reference materials provided. Once you have done that, I recommend watching the videos again to check your understanding. You will take a few quizzes as you progress through the material to make sure you are keeping up.
What's included
7 videos4 readings2 assignments1 peer review
In this module, we will cover how to refine plots created in ggplot2. You should begin by watching the introductory videos in each lesson. Then, carefully review the readings and reference materials provided. Once you have done that, I recommend watching the videos again to check your understanding. You will take a few quizzes as you progress through the material to make sure you are keeping up. Then, at the end of the module, you will submit an assignment for peer review that covers all of the material in this course.
What's included
6 videos8 readings3 assignments1 peer review
Earn a career certificate
Add this credential to your LinkedIn profile, resume, or CV. Share it on social media and in your performance review.
Instructor

Offered by
Explore more from Data Analysis
 Status: Free Trial
Johns Hopkins University
 Status: Free Trial
Johns Hopkins University
 Status: Free Trial
Johns Hopkins University
 Status: Free Trial
Johns Hopkins University
Why people choose Coursera for their career


Learner reviews
130 reviews
- 5 stars
91.53%
- 4 stars
7.69%
- 3 stars
0.76%
- 2 stars
0%
- 1 star
0%
Showing 3 of 130
Reviewed on Dec 18, 2024
Great. Well explained and interactive. Simulatenaously going through practical examples to teach, rather than just talking and it becoming a video to watch.
Reviewed on Apr 14, 2021
The course is very interesting. It helped me improve my skills with different graphs and charts
Reviewed on Apr 18, 2021
Excellent course, learned a lot; looking forward to the next one in the series.

Open new doors with Coursera Plus
Unlimited access to 10,000+ world-class courses, hands-on projects, and job-ready certificate programs - all included in your subscription
Advance your career with an online degree
Earn a degree from world-class universities - 100% online
Join over 3,400 global companies that choose Coursera for Business
Upskill your employees to excel in the digital economy
Frequently asked questions
To access the course materials, assignments and to earn a Certificate, you will need to purchase the Certificate experience when you enroll in a course. You can try a Free Trial instead, or apply for Financial Aid. The course may offer 'Full Course, No Certificate' instead. This option lets you see all course materials, submit required assessments, and get a final grade. This also means that you will not be able to purchase a Certificate experience.
When you enroll in the course, you get access to all of the courses in the Specialization, and you earn a certificate when you complete the work. Your electronic Certificate will be added to your Accomplishments page - from there, you can print your Certificate or add it to your LinkedIn profile.
Yes. In select learning programs, you can apply for financial aid or a scholarship if you can’t afford the enrollment fee. If fin aid or scholarship is available for your learning program selection, you’ll find a link to apply on the description page.
More questions
Financial aid available,
¹ Some assignments in this course are AI-graded. For these assignments, your data will be used in accordance with Coursera's Privacy Notice.

