
Filter by
The language used throughout the course, in both instruction and assessments.
Build job-relevant skills in under 2 hours with hands-on tutorials.
Learn from top instructors with graded assignments, videos, and discussion forums.
Get in-depth knowledge of a subject by completing a series of courses and projects.
Graduate level learning within reach.
55 results for "seaborn"

Coursera Project Network
Skills you'll gain: Machine Learning, Regression, Python Programming
 Status: Free
Ball State University
Coursera Project Network
Skills you'll gain: Python Programming

Coursera Project Network
Skills you'll gain: Data Analysis, Machine Learning
Coursera Project Network
Skills you'll gain: Data Science, Machine Learning, Python Programming
Coursera Project Network

Coursera Project Network
Skills you'll gain: Data Visualization
Searches related to seaborn
In summary, here are 10 of our most popular seaborn courses
- XG-Boost 101: Used Cars Price Prediction: Coursera Project Network
- Introduction to Programming: Ball State University
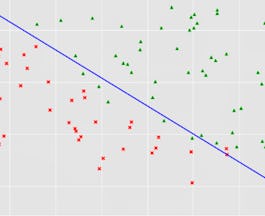
- MatplotLib Python باستخدام plots إنشاء ال: Coursera Project Network
- تعلم الآلة باستخدام Python: انشئ نموذج توقع مغادرة العملاء: Coursera Project Network
- Regresión logística con NumPy y Python: Coursera Project Network
- Visualizaciones de Datos con Python utilizando Matplotlib: Coursera Project Network
- DataViz - Grammaire des Graphiques avec Python: Coursera Project Network


