
Filter by
The language used throughout the course, in both instruction and assessments.
4,832 results for "data visualization"

Coursera Project Network
Skills you'll gain: Data Analysis
Coursera Project Network
Skills you'll gain: Data Analysis
Splunk Inc.
Skills you'll gain: Data Analysis, Data Visualization, Statistical Visualization, Data Analysis Software, General Statistics, Interactive Data Visualization, Data Management, Data Visualization Software, Databases, Exploratory Data Analysis, Extract, Transform, Load, Statistical Analysis, Basic Descriptive Statistics, Data Structures, Differential Equations, Probability & Statistics, Visualization (Computer Graphics), Big Data, User Research, Business Analysis, Business Intelligence, Data Science
Coursera Project Network
Skills you'll gain: Big Data, Python Programming
Coursera Project Network
Coursera Project Network
 Status: Free
Coursera Project Network
Skills you'll gain: Data Analysis

Fred Hutchinson Cancer Center

Microsoft
Skills you'll gain: Business Analysis, Data Analysis, Data Visualization, Leadership and Management, Microsoft Excel, Power BI, Risk Management

Skills you'll gain: Data Management

Coursera Project Network
Skills you'll gain: Data Analysis, Databases, Problem Solving, SQL

University of Washington
Skills you'll gain: Algorithms, Human Learning, Machine Learning, Machine Learning Algorithms, Applied Machine Learning, Python Programming, Probability & Statistics, Data Analysis, Machine Learning Software, Statistical Machine Learning
Searches related to data visualization
In summary, here are 10 of our most popular data visualization courses
- Using Covid-19 Data to Make Supply Chain Logistics Decisions in Spreadsheets: Coursera Project Network
- Analyze Sales Data with LibreOffice Base Queries: Coursera Project Network
- Splunk Search Expert: Splunk Inc.
- Working with Big Data: Coursera Project Network
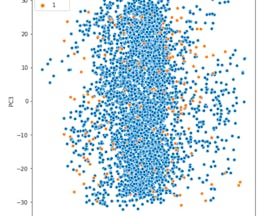
- Handling Imbalanced Data Classification Problems: Coursera Project Network
- Create a Marketing Analysis dashboard using G-Spreadsheets: Coursera Project Network
- GenAI for Data Analysis : OpenAI Assistant API : Coursera Project Network
- Researcher's guide to RNA sequencing data: Fred Hutchinson Cancer Center
- Microsoft Business Analyst: Microsoft
- Data Connection and Functionalities in Power BI: Edureka


