
Filter by
The language used throughout the course, in both instruction and assessments.
182 results for "creating dashboards"

University of California, Irvine

Coursera Project Network
Google Cloud
Skills you'll gain: Cloud Computing, Data Analysis, Data Visualization, Google Cloud Platform
Coursera Project Network
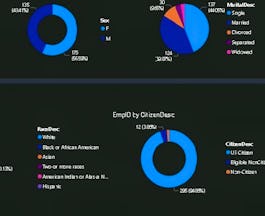
Skills you'll gain: Data Visualization, Human Resources

University of California, Irvine
Skills you'll gain: Cloud Computing, Data Management, Leadership and Management, Salesforce
Coursera Project Network
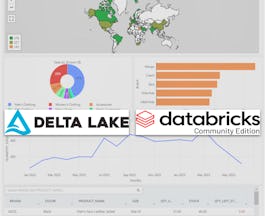
Skills you'll gain: Big Data, Data Management, SQL
Coursera Project Network
Skills you'll gain: Interactive Data Visualization, Power BI

University of Colorado System
Skills you'll gain: Business Analysis, Business Intelligence, Data Visualization

Microsoft
Skills you'll gain: Data Analysis, Data Management, Data Mining, Data Model, Data Visualization, Extract, Transform, Load, Microsoft Excel, Power BI, SQL

Skills you'll gain: Data Management, Machine Learning
 Status: Free
Skills you'll gain: Data Visualization

Searches related to creating dashboards
In summary, here are 10 of our most popular creating dashboards courses
- Dashboarding and Deployment: University of California, Irvine
- إنشاء لوحة تحكم للبورصة باستخدام أوراق جوجل: Coursera Project Network
- Creating Tile-based Dashboard Alerts in Looker: Google Cloud
- HR Analytics- Build an HR dashboard using Power BI: Coursera Project Network
- Salesforce Fundamentals: University of California, Irvine
- Data Management with Databricks: Big Data with Delta Lakes: Coursera Project Network
- Build an Income Statement Dashboard in Power BI: Coursera Project Network
- Business Intelligence Concepts, Tools, and Applications: University of Colorado System
- Microsoft Power BI Data Analyst: Microsoft
- Mastering Power BI for Data Analytics & Storytelling: Edureka


